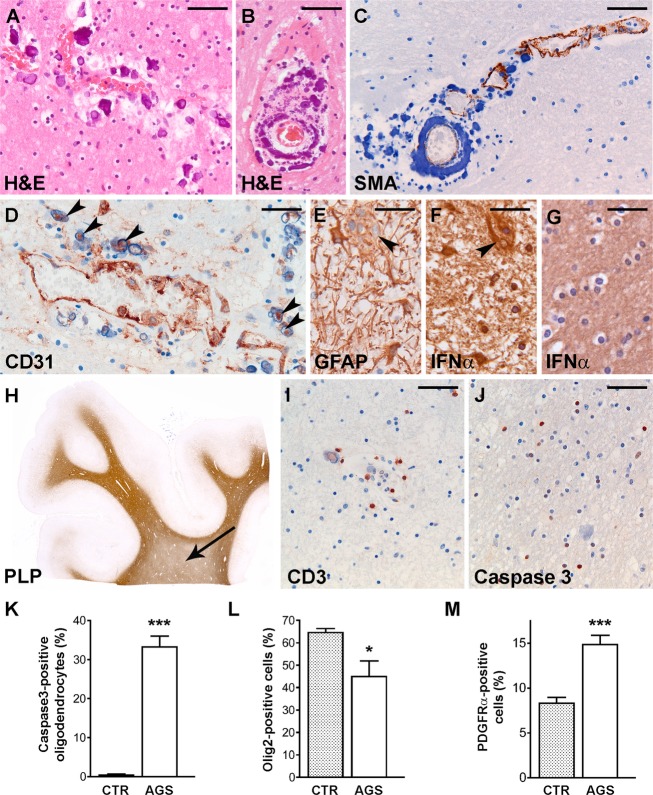
Figure 2.
Neuropathology. (A and B) H&E stain show perivascular calcifications (purple) with a concentric pattern around blood vessels in the parietal white matter (A) and in the cerebellum (B). (C) Stain against SMA (brown) of the cerebellar white matter shows that calcifications (blue) are located in the tunica media and lined by SMA-positive smooth muscle cells. Note that the normal SMA-immunoreactivity (upper right) is progressively lost coincident with increasing vessel calcification (lower left). (D) Stain against CD31 of the frontal white matter reveals that apparently perivascular small calcifications are often centered on a CD31-immunoreactive core (arrowheads). (E) At high magnification, GFAP stain of the frontal white matter shows reactive astrocytes, one of which is multinucleated (arrowhead). (F) In the same region, a multinucleated astrocyte (arrowhead) shows a similarly intense IFN-α-immunoreactivity compared to mononucleated astrocytes. (G) Control frontal white matter shows no IFN-α-positive astrocytes. (H) Whole mount of a noninfarcted area in the frontal lobe stained against PLP reveals mild lack of myelin in the deep white matter (arrow) compared to the U-fibers. (I) Stain against CD3 of the frontal white matter shows few infiltrating T-cells mostly restricted to the perivascular space. (J) Caspase3 stain of the same region reveals numerous immunoreactive cells with small, round nuclei, and a perinuclear halo, compatible with apoptotic oligodendrocytes. (K) Caspase3-positive oligodendrocytes are virtually absent in control fronto-parietal white matter (P < 0.0001). (L) Cell counts of cells expressing the oligodendrocyte lineage-specific marker olig2 in the fronto-parietal white matter shows mild loss of oligodendrocytes in AGS compared to controls (P = 0.036). (M) There are higher numbers of OPCs in the noninfarcted white matter of the AGS patient compared to the controls as revealed by PDGFRα immunoreactivity (P < 0.0001). Bars: (A, B, I and J) 50 μm, (C and D) 40 μm, (E–G) 30 μm. Bars in the graphs indicate the standard error of the mean. H&E, Hematoxylin & Eosin; SMA, smooth muscle actin; GFAP, glial fibrillary acidic protein; IFN, interferon; PLP, proteolipid protein; AGS, Aicardi–Goutières syndrome; OPC, oligodendrocyte progenitor cell; PDGFRα, platelet-derived growth factor α receptor. *, P < 0.05; *** P < 0.001.

