
Fig 1.
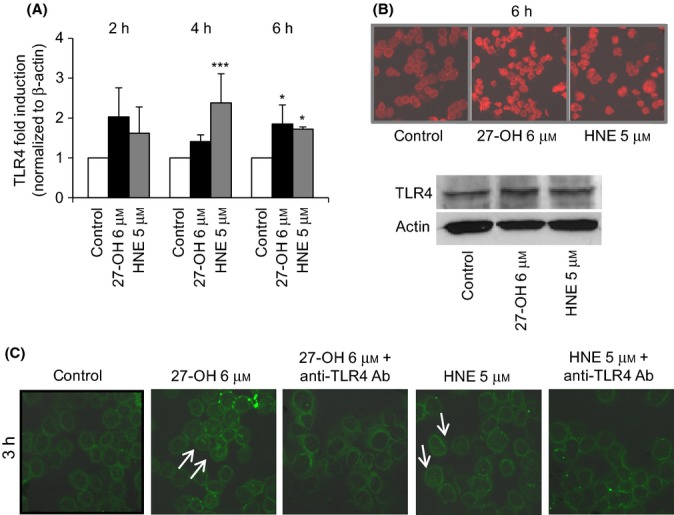
Activation of TLR4/NF-κB pathway by 27-OH and HNE in U937 cells. Cells were incubated with 6 μm 27-OH or 5 μm HNE. (A) TLR4 expression was quantified after incubation with 27-OH or HNE by real-time RT–PCR for up to 6 h. Data are means ± SD of four experiments and are expressed as fold induction vs. control (untreated cells). ***P < 0.001 and *P < 0.05 vs. control. (B) After cell treatment for 6 h, TLR4 protein levels were detected by confocal laser microscopy using a TRITC-conjugated secondary antibody (532-nm exciting laser band, 572-nm long-pass emission filter, and 40x/0.75 lens). The images are representative of three experiments. TLR4 protein levels were also analyzed by Western blotting after 6-h cell treatment. The blot is representative of two experiments. (C) After cell co-treatment with 0.2 μg mL-1 TLR4 antibody and with 27-OH or HNE for 3 h, cytoplasmic and nuclear localization of p65, a subunit of NF-κB, was visualized by confocal laser microscopy using a FITC-conjugated secondary antibody (488-nm exciting laser band and emission passing through a long-pass 505-550 filter, lens 40x/0.75). The images are representative of three experiments.