
Fig 7.
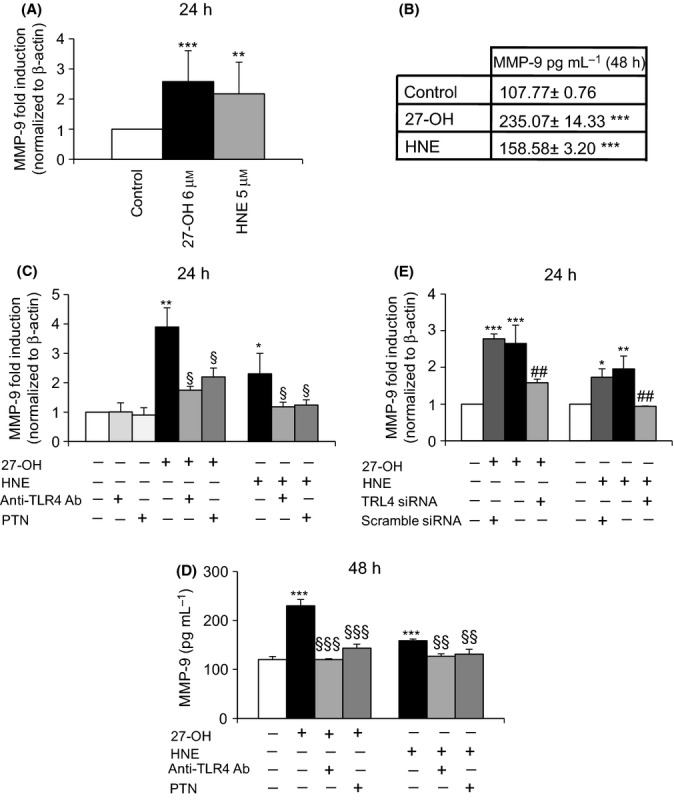
27-OH and HNE induce MMP-9 through the TLR4/NK-κB signaling pathway. (A) MMP-9 gene expression was evaluated by real-time RT–PCR after 24-h cell incubation with 6 μm 27-OH or 5 μm HNE. The histograms represent the mean values ± SD of three experiments. ***P < 0.001 and **P < 0.01 vs control. (B) Protein levels of MMP-9 were measured by ELISA after 48-h cell incubation. Data are means ± SD of four experiments; protein concentrations (pg mL-1) were extrapolated from the standard curve. ***P < 0.001 vs. control. (C) MMP-9 expression was analyzed by real time RT–PCR in U937 cells co-treated with 0.2 μg mL-1 anti-TLR4 antibody or pretreated with 1 μM parthenolide (PTN) and then incubated with 6 μm 27-OH or 5 μm HNE for 24 h. The histograms represent the mean values ± SD of three experiments. **P < 0.01 and *P < 0.05 vs. control; §P < 0.05 vs. 27-OH or HNE. (D) MMP-9 protein levels were measured by ELISA after 48-h cell incubation with 27-OH or HNE with or without co-treatment with an anti-TLR4 antibody or pretreatment with PTN. Data are means ± SD of three experiments. ***P < 0.001 vs. control; §§§P < 0.001 and §§P < 0.05 vs. 27-OH or HNE. (E) U937 cells were transfected for 24 h with a specific TLR4 siRNA, and MMP-9 expression was evaluated after 24 h of incubation with 27-OH or HNE by real-time RT–PCR. Scramble siRNA (negative control) corresponds to a siRNA with nonspecific sequence. Data are expressed as mean values ± SD of three experiments. ***P < 0.001, **P < 0.01, and *P < 0.05 vs. control; ##P < 0.01 vs. 27-OH or HNE.