
Fig 8.
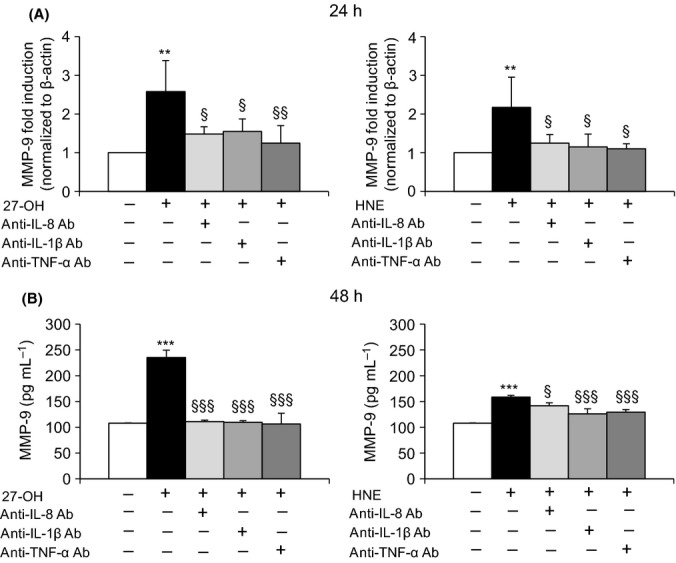
Effect of inhibiting cytokine release on MMP-9 levels. U937 cells were treated with 6 μm 27-OH or 5 μm HNE in the presence or the absence of 0.04 μg mL-1 of IL-8, IL-1β, or TNF-α primary antibodies. (A) MMP-9 expression was measured by real-time RT–PCR at 24 h. The histograms represent the mean values ± SD of three experiments and are expressed as fold induction versus control (untreated cells). **P < 0.01 vs. control; §§P < 0.01 and §P < 0.05 vs. 27-OH or HNE. (B) MMP-9 protein levels were measured by ELISA after 48-h cell incubation. Data are means ± SD of three experiments; protein concentrations (pg mL-1) were extrapolated from the standard curve. ***P < 0.001 vs. control; §§§P < 0.001 and §P < 0.05 vs. 27-OH or HNE.