
Fig 4.
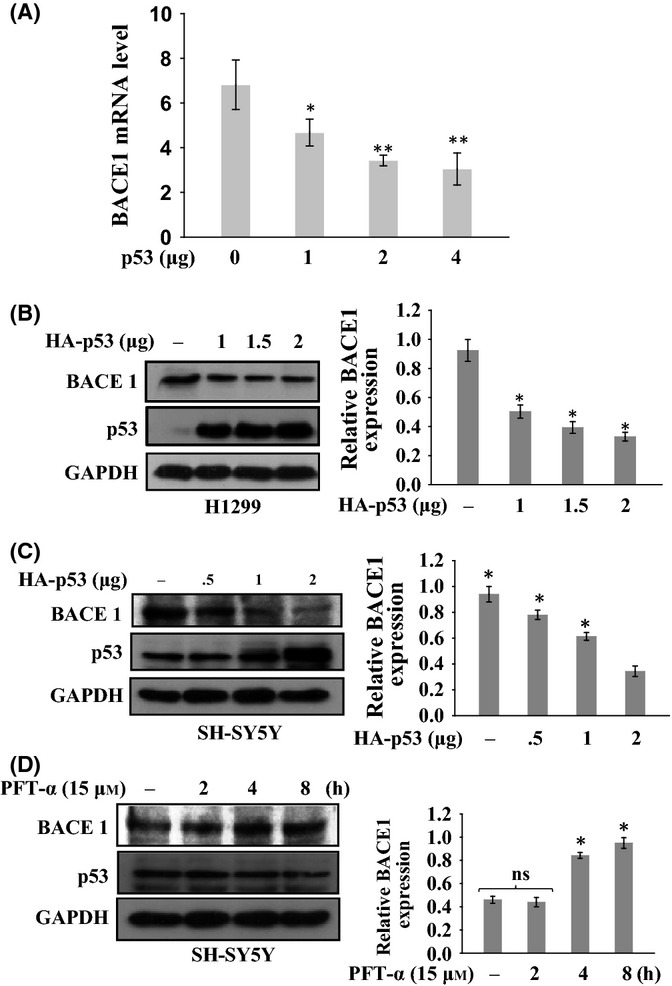
Transcriptional repression of BACE1 by p53. (A) Effect of p53 on BACE1 mRNA level. SH-SY5Y cells were transfected with increasing amount (1, 2, and 3 μg) of p53. Quantitative real-time PCR analysis was performed. The endogenous BACE1 mRNA level decreases with increasing p53 expression. (B–C) Effect of p53 on BACE1 protein level. (A) H1299 and (C) SH-SY5Y cells were transfected with increasing amount (1, 1.5, and 2 μg) of p53 expression constructs. (D) Effect of inhibited endogenous p53 on BACE1 level. SH-SY5Y cells were treated with PFT-α (15 μm) for indicated time period to inhibit endogenous p53. Endogenous BACE1 protein levels were determined by Western blotting using anti-BACE1 antibodies. Data represent the mean ± SE from three independent experiments. Statistical analysis were performed by one-group t-test for the significance at the *=P < .005 and **=P < 0.001. ns, nonsignificant.