
Fig 1.
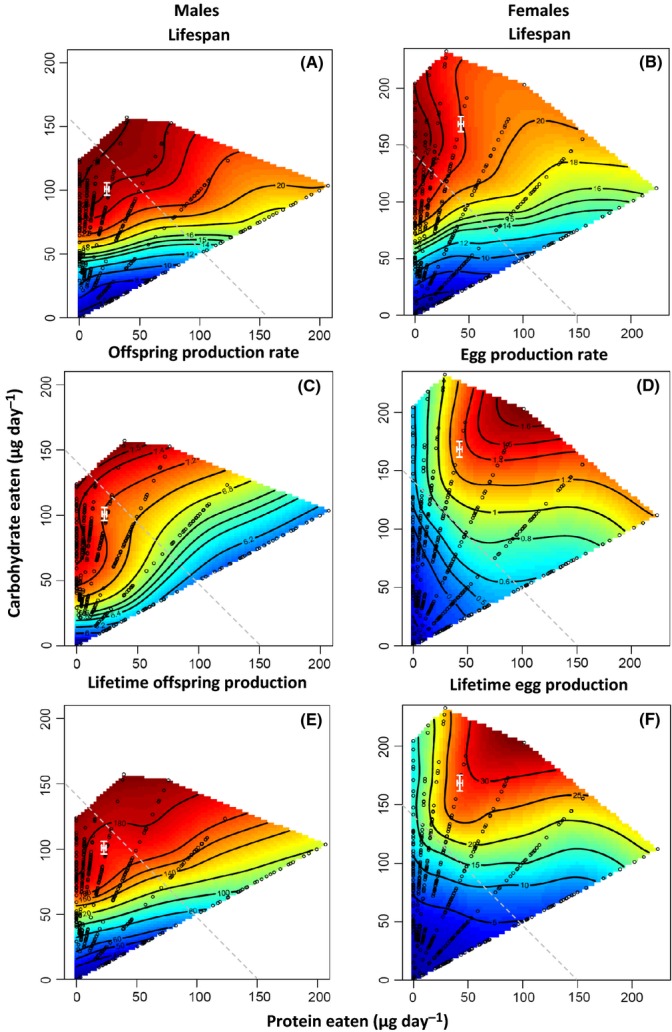
Nonparametric thin-plate spline contour visualizations of the responses surfaces describing the effects of protein and carbohydrate intake on (A) male lifespan (LS), (B) female LS, (C) male offspring production rate, (D) female egg production rate, (E) lifetime offspring production in males, and (F) lifetime egg production in females in Drosophila melanogaster. Individual flies were allowed to feed ad libitum from one of the 29 liquid foods across their adult LS. Open black circles represent the intake of protein and carbohydrates along each of the seven nutritional rails by individual flies. The regulated intake point (±SE) for flies given the choice between alternate diets (Experiment 2) is mapped on each landscape (in white), after being converted to a daily intake. On each landscape, the gray dashed line represents an ‘isocaloric line’ across the nutritional landscape where a given intake of nutrients yields equal calories. As protein and carbohydrates contain approximately the same amount of energy per unit ingested (∼4 calories per gram), the slope of the isocaloric line is −1.