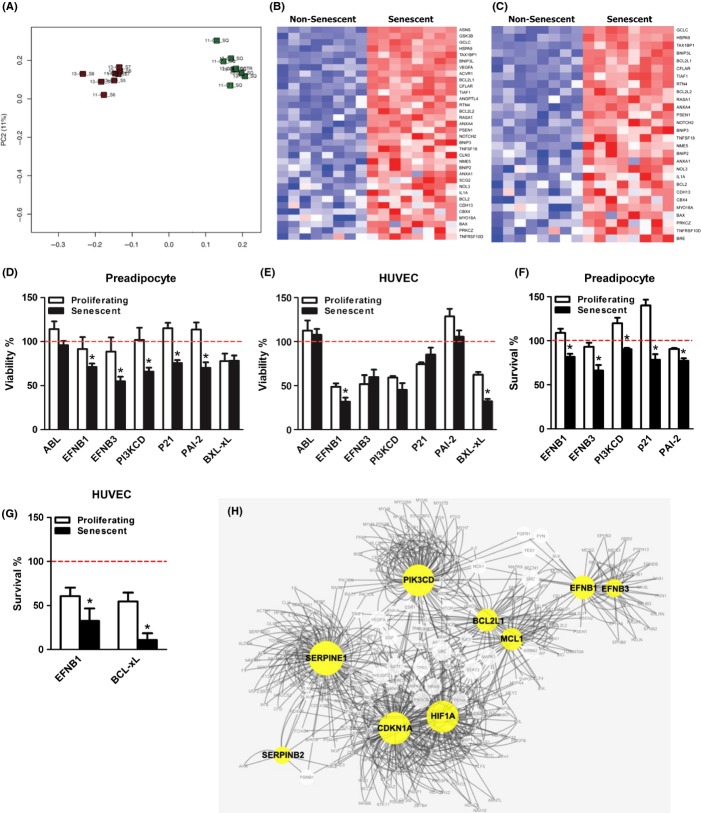
Fig 1.
Senescent cells can be selectively targeted by suppressing pro-survival mechanisms. (A) Principal components analysis of detected features in senescent (green squares) vs. nonsenescent (red squares) human abdominal subcutaneous preadipocytes indicating major differences between senescent and nonsenescent preadipocytes in overall gene expression. Senescence had been induced by exposure to 10 Gy radiation (vs. sham radiation) 25 days before RNA isolation. Each square represents one subject (cell donor). (B, C) Anti-apoptotic, pro-survival pathways are up-regulated in senescent vs. nonsenescent cells. Heat maps of the leading edges of gene sets related to anti-apoptotic function, ‘negative regulation of apoptosis’ (B) and ‘anti-apoptosis’ (C), in senescent vs. nonsenescent preadipocytes are shown (red = higher; blue = lower). Each column represents one subject. Samples are ordered from left to right by proliferative state (N = 8). The rows represent expression of a single gene and are ordered from top to bottom by the absolute value of the Student t statistic computed between the senescent and proliferating cells (i.e., from greatest to least significance, see also Fig. S8). (D–E) Targeting survival pathways by siRNA reduces viability (ATPLite) of radiation-induced senescent human abdominal subcutaneous primary preadipocytes (D) and HUVECs (E) to a greater extent than nonsenescent sham-radiated proliferating cells. siRNA transduced on day 0 against ephrin ligand B1 (EFNB1), EFNB3, phosphatidylinositol-4,5-bisphosphate 3-kinase delta catalytic subunit (PI3KCD), cyclin-dependent kinase inhibitor 1A (p21), and plasminogen-activated inhibitor-2 (PAI-2) messages induced significant decreases in ATPLite-reactive senescent (solid bars) vs. proliferating (open bars) cells by day 4 (100, denoted by the red line, is control, scrambled siRNA). N = 6; *P < 0.05; t-tests. (F–G) Decreased survival (crystal violet stain intensity) in response to siRNAs in senescent vs. nonsenescent preadipocytes (F) and HUVECs (G). N = 5; *P < 0.05; t-tests. (H) Network analysis to test links among EFNB-1, EFNB-3, PI3KCD, p21 (CDKN1A), PAI-1 (SERPINE1), PAI-2 (SERPINB2), BCL-xL, and MCL-1.

