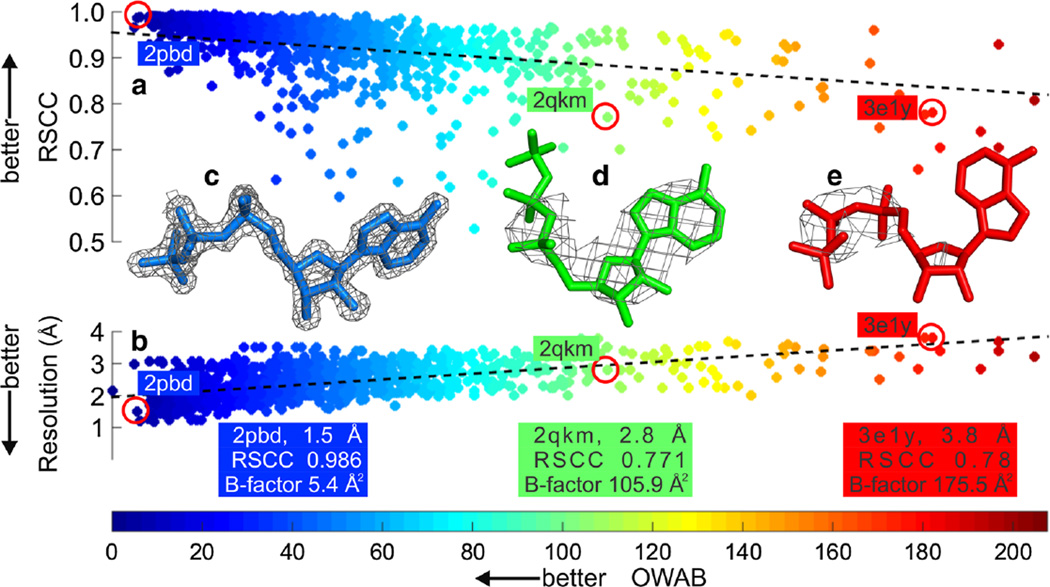
Fig. 2.
Local versus global measures of error in protein–ligand models a Plot of RSCC against OWAB and b resolution against OWAB. 1,183 data points are shown in each plot for adenosine triphosphate (ATP). RSCC is a metric used to determine the local measure of ligand fit to the electron density and OWAB is a local measure of the displacement of the atoms of the ligand. RSCC and OWAB values were calculated using Twilight [12, 15]. The latest pre-calculated Twilight data are available at http://bit.ly/1shcwu4. c through e demonstrate the sensitivity of the local RSCC and OWAB metrics to global metrics such as resolution. The ATP is shown as sticks and a σA-weighted 2mFo–DFc electron density map is shown as a grey mesh contoured at 2σ. The corresponding RSCC and resolution values for the ATP ligands are highlighted by red circles in a and b, respectively

