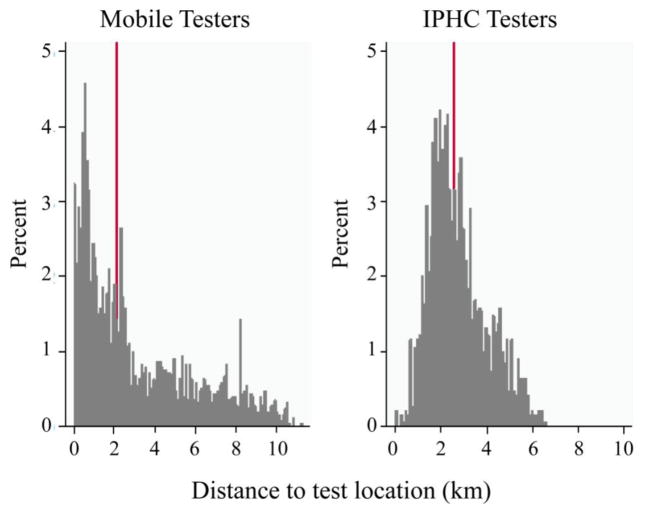
Figure 2. Distribution of IPHC and mobile testers by distance traveled to test location.
This graph shows the distribution of IPHC and mobile testers by the distance between their home and the site of HIV testing. The red line represents the median distance (mobile testers 2.1 km [IQR: 0.8–4.9 km], IPHC testers 2.5 km [IQR: 1.8–3.5 km], p<0.001).

