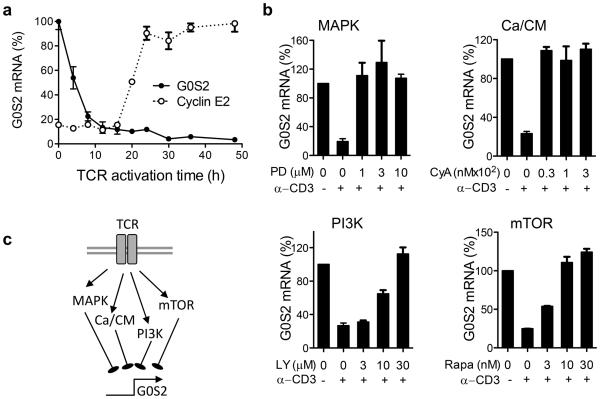
Figure 1. G0S2 expression is regulated downstream of TCR signaling pathways.
(a) Kinetics of G0S2 and cyclin E2 transcripts were measured by qPCR in CD8+ T cells activated with plate-bound anti-CD3 and anti-CD28. (b) G0S2 expression in the presence of PD98059 (PD), cyclosporin A (CyA), LY294002 (LY), and rapamycin (Rapa). (c) Diagram depicting regulation of G0S2 expression downstream of TCR signals. Data are representative of three independent experiments.

