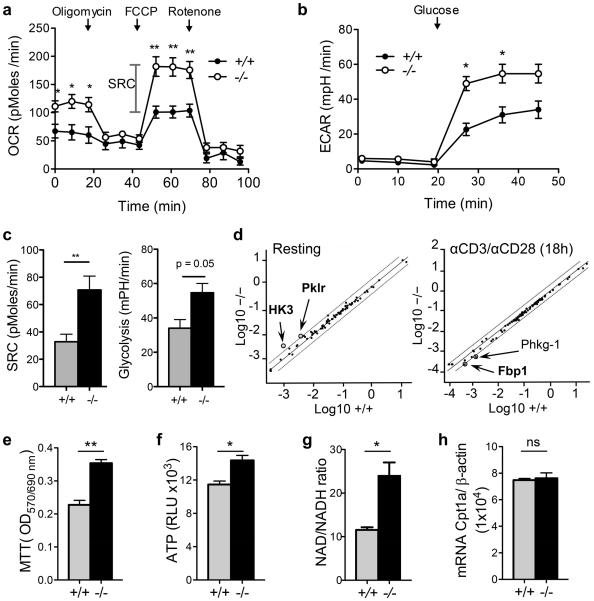
Figure 3. Increased mitochondrial respiratory capacity in G0s2−/− CD8+ T cells.
(a) Oxygen consumption rates (OCR) were measured in real time in wild type and G0s2−/− CD8+ T cells activated with plate-bound anti-CD3 under basal conditions and after addition of oligomycin, FCCP, and rotenone (n = 4). (b) Extracellular acidification rates (ECAR) were measured as described in (a). (c) Calculated spare respiratory capacity (SRC) and glycolysis. (d) Scatter plot of glucose metabolism qPCR array comparing resting and activated (18 hours) wild type and G0s2−/− CD8+ T cells. (e) Cell growth of activated CD8+ T cells was determined using the colorimetric MTT assay (n = 4). (f) ATP levels of activated CD8+ T cells (n = 4). (g) Content of NAD and NADH in activated CD8+ T cells (n = 3). (h) Relative Cpt1a mRNA expression was determined by qPCR (n = 4). *, P < 0.05; **, P < 0.01 (two-tailed Student’s t-test).

