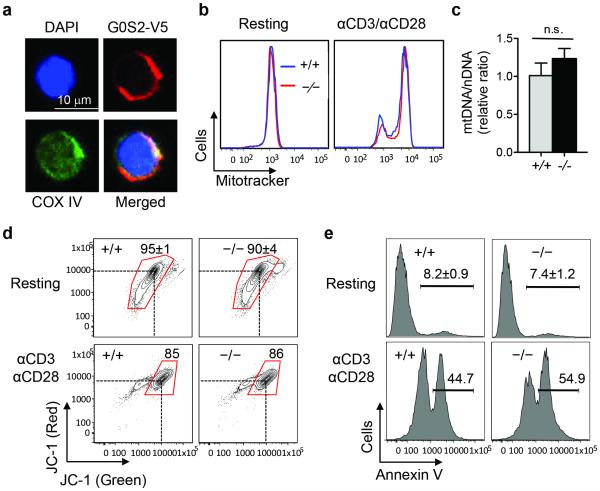
Figure 4. Normal mitochondrial biogenesis in G0s2−/− CD8+ T cells.
(a) Subcellular localization of G0S2 (red), COX IV (green), and DAPI (blue) in CD8+ T cells with retroviral expression of V5-tagged G0S2. (b) Flow cytometric detection of mitochondrial content in resting and anti-CD3/anti-CD28 activated CD8+ T cells using MitoTracker. (c) Mitochondrial DNA (mDNA) and nuclear DNA (nDNA) were determined by qPCR in CD8+ T cells (n = 3). n.s., no statistical significance. (d) Flow cytometric detection of mitochondrial membrane potential using JC-1 dye in resting and activated CD8+ T cells. (e) Detection of apoptotic cells by Annexin V staining in resting and activated CD8+ T cells.

