Figure 1.
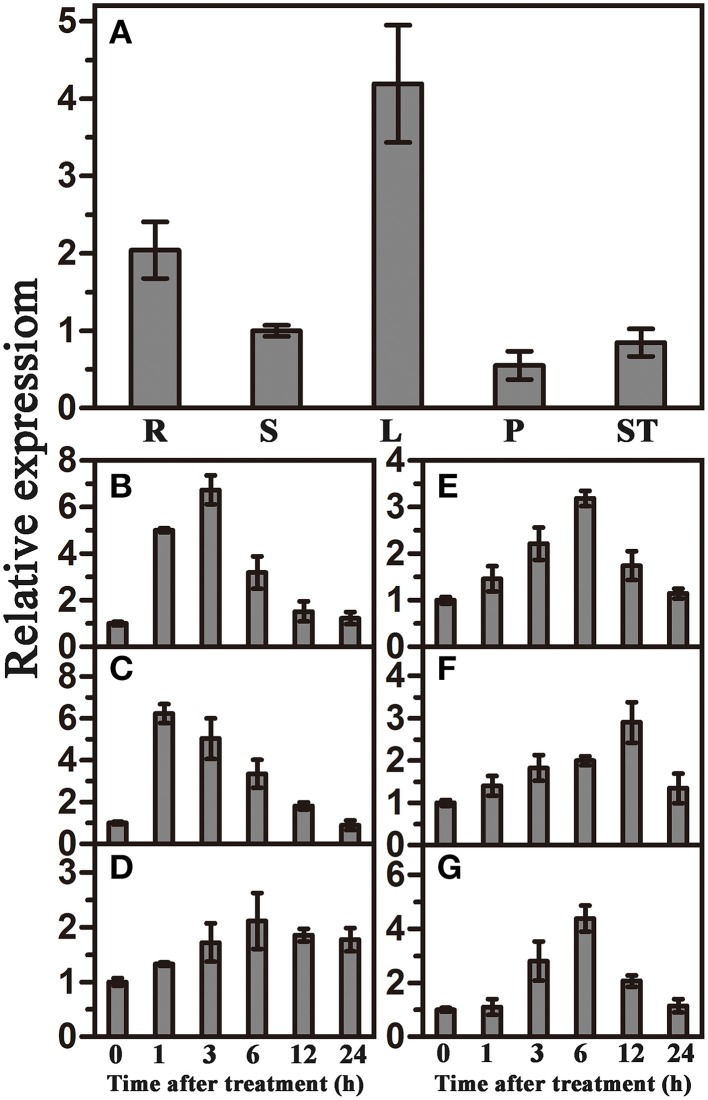
Organ expression assay of TaWRKY44 and expression profiles of TaWRKY44 under treatments with PEG, NaCl, 4°C, ABA, GA, and H2O2 in wheat leaves. (A) Organ expression assay of TaWRKY44 in wheat. The organs (root, stem, leaf, pistil, and stamen) are represented by R, S, L, P, and ST, respectively. Expression analysis of TaWRKY44 in 10-day-old wheat seedling leaves under different treatments by qRT-PCR, (B) 20% PEG6000; (C) 200 mM NaCl; (D) 4°C; (E) 100 μM ABA; (F) 10 mM H2O2; (G) 5 μM GA. For each assay, the expression level at time point 0 (for the stress assay) and stem (for the organ expression assay) was defined as 1.0, and the expression level at other time points and in other tissues was normalized accordingly. Error bars show the standard deviations for three independent replicates.

