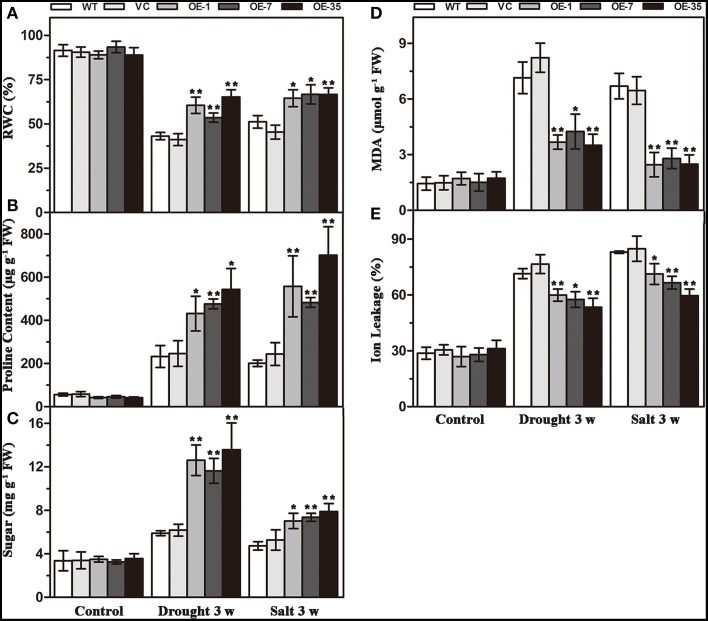
Figure 5.
Analysis of the physiological indices in the control (WT and VC) and transgenic lines (OE-1, OE-7 and OE-35) under normal and drought/salt conditions. Five-week-old plants were subjected to drought and salt treatments for 3 weeks, then the leaves were sampled to assess the value of RWC (A), proline content (B), soluble sugar content (C), MDA content (D), and IL (E). Data are the means ±SD calculated from three replicates. *(P < 0.05) and **(P < 0.01) indicate that the value in the transgenic lines is significantly different from that of the WT. Three biological experiments produced similar results.

