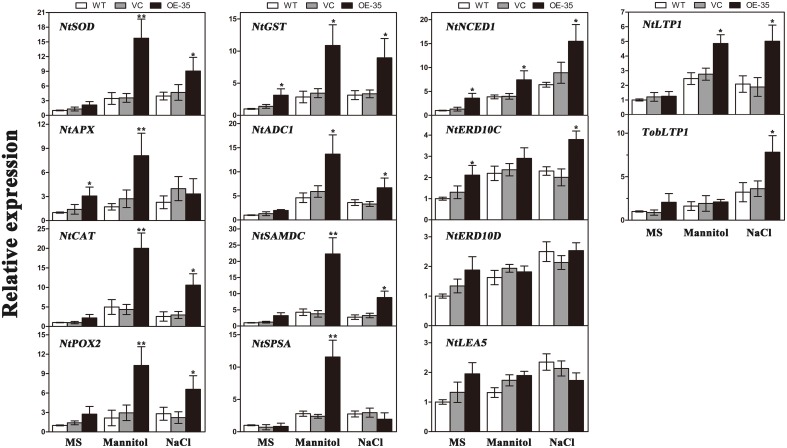
Figure 8.
Expression levels of ROS-related and stress-responsive genes in the WT, VC and the transgenic lines (OE-35) under normal and osmotic conditions analyzed qRT-PCR. Two-week-old seedlings cultured on MS medium were transplanted to MS with mannitol (300 mM) and NaCl (200 mM) for 1 week. The tobacco leaves were then sampled to extract the total RNA to generate cDNA. Fourteen gene expression levels were detected; the NtActin gene was used as the internal control for normalization. Data are means ±SD calculated from three replicates. *(P < 0.05) and **(P < 0.01) indicate that the value in the transgenic line is significantly different from that of the WT. Three biological experiments produced similar results.

