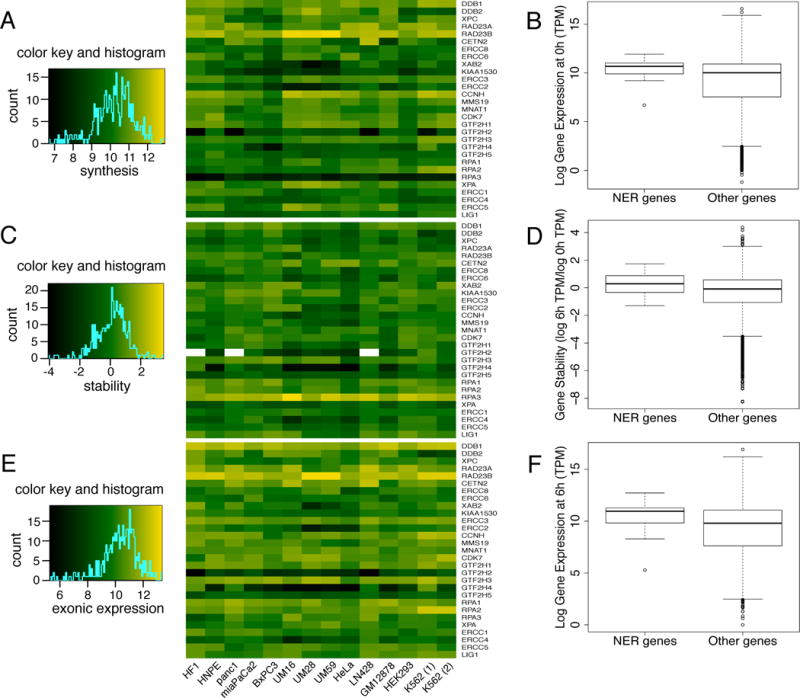
Figure 4.

Expression of the 29 NER genes in 13 human cell lines. (A) Relative rates of RNA synthesis of NER genes as determined by Bru-seq. (B) Boxplots showing the comparisons of RNA synthesis between NER genes and all other expressed genes in cell line HF1. (C) Relative RNA stability of NER transcripts as determined by BruChase-seq. (D) Boxplots showing the comparisons of relative RNA stability between NER genes and all other expressed genes in cell line HF1. (E) Exonic reads of 6-hour old NER RNAs. (F) Boxplots showing the comparisons of exonic reads of 6-hour old RNA between NER genes and all other expressed genes in cell line HF1. The boxplots are used to demonstrate the distribution of the data where the horizontal line inside the box indicates the median (50th percentile). The edges of the boxes indicate the 25th and 75th percentile and the spaces between them are called interquartile ranges. Whiskers extend from the box edges up to the most extreme point that is not more than 1.5 times the interquartile range. Individual data points more extreme than the extension of the whiskers are indicated with circles.
