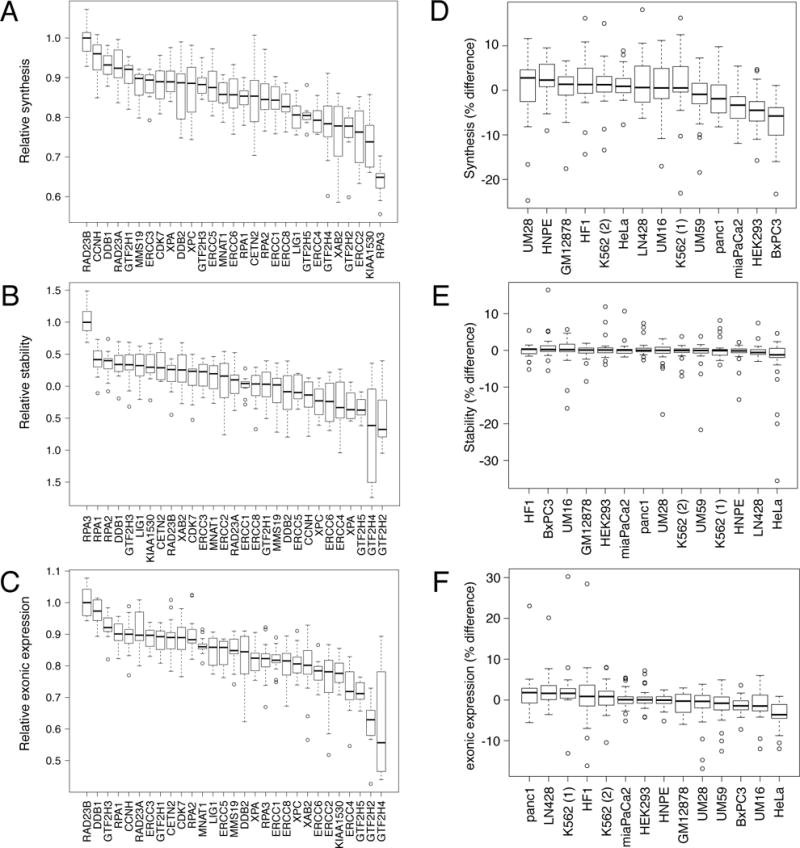
Figure 5.

Comparative analysis of transcription regulation across genes and cell lines. Relative transcript synthesis (A), stability (B), and exonic signal in 6-hour old RNA (C). Data is grouped by gene to indicate genes with highest and lowest values. Transcript percent difference from median values (calculated across cell lines) in synthesis (D), stability (E), and exonic signal in 6-hour old RNA (F). Data is grouped by cell lines to indicate cell lines with the greatest discrepancies from the median expression of each gene. Boxplots are designed as described in Fig. 4.
