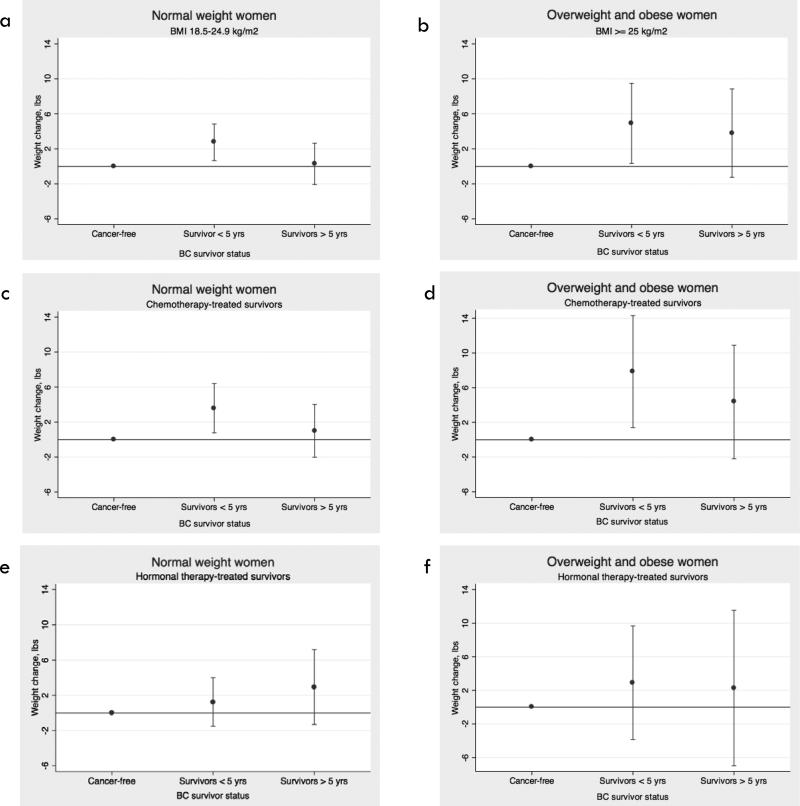
Figure 3.
Adjusted 4-year weight gain in survivors, stratified by time since diagnosis, treatment category, and BMI category at T1, compared to cancer-free women. Estimates for weight gain among (a) women with BMI between 18.5 kg/m2 and 25 kg/m2, (b) women with BMI ≥ 25 kg/m2, (c) survivors treated with chemotherapy and cancer-free women, with BMI between 18.5 kg/m2 and 25 kg/m2, (d) survivors treated with chemotherapy and cancer-free women, with BMI ≥ 25 kg/m2, (e) survivors treated with hormone therapy alone and cancer-free women, with BMI between 18.5 kg/m2 and 25 kg/m2, (f) survivors treated with hormone therapy alone and cancer-free women, with BMI ≥ 25 kg/m2.

