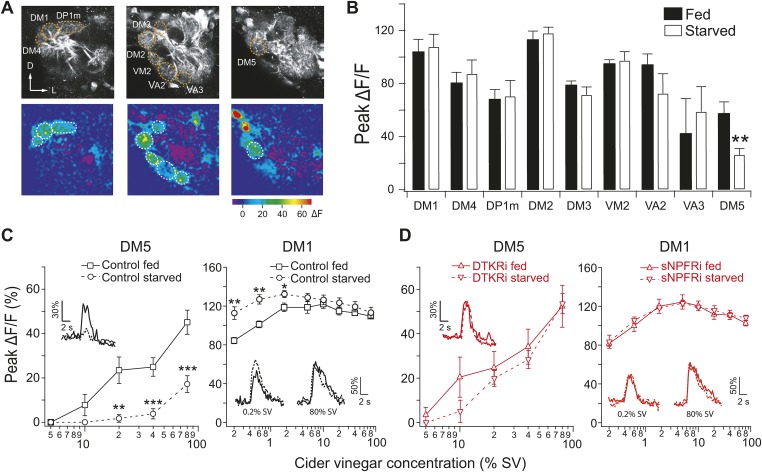
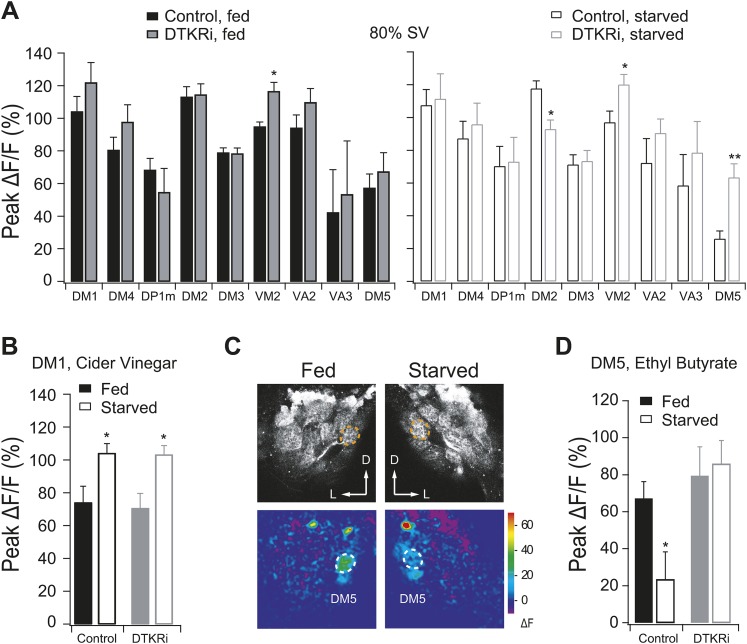
Figure 2. Starvation-dependent neuropeptide signaling modulates sensitivity of the DM1 and DM5 glomeruli.
(A) Representative two photon images of projection neuron (PN) dendritic calcium responses to 80% saturated vapor (SV) of apple cider vinegar in starved DTKR knockdown flies. Grey-scale images show the glomerular map on three optical planes whereas the pseudocolored images show the change of fluorescence. (B) Peak ΔF/F in glomeruli that are activated by 80% SV cider vinegar in fed and starved flies. (C, D) Responses in the DM1 and DM5 glomeruli at varying concentrations in fed and starved control flies (C) and in flies that express DTKR-RNAi or sNPFR-RNAi in ORNs labeled by Orco-Gal4 (D). Calcium signals for PN responses were imaged using GH146-LexA, LexAop-GCaMP flies in addition to the indicated transgenes. n = 5–7 for each. Error bars show s.e.m. *p < 0.05, **p < 0.01, ***p < 0.001; Student's t-test comparing between starved and fed responses.
DOI: http://dx.doi.org/10.7554/eLife.08298.006


