Figure 2.
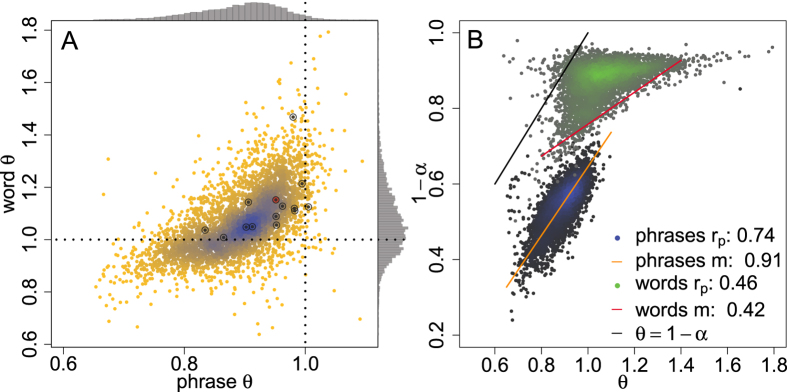
A.Density plot showing the Zipf exponent θ for ‘one-off’ randomly partitioned phrase and word Zipf distributions (q = 1 and q =  ) for around 4000 works of literature. We indicate “Tale of Two Cities” by the red circle, and with black circles, we represent measurements for 14 other works of literature analyzed further in the supplementary material. Marginal distributions are plotted as histograms along the edges of panel A and highlight how phrases typically exhibit θ ≤ 1 whereas words produce unphysical θ > 1, according to Simons model. B. Test of the Simon model’s analytical connection θ = 1 − α, where θ is the Zipf exponent and α is the rate at which new terms (e.g., graphemes, words, phrases) are introduced throughout a text. We estimate α as the number of different words normalized by the total word volume. For both words and phrases, we compute linear fits using Reduced Major Axis (RMA) regression24 to obtain slope m along with the Pearson correlation coefficient rp. Words (green) do not exhibit a simple linear relationship whereas phrases do (blue), albeit clearly below the α = 1 − θ line in black.

