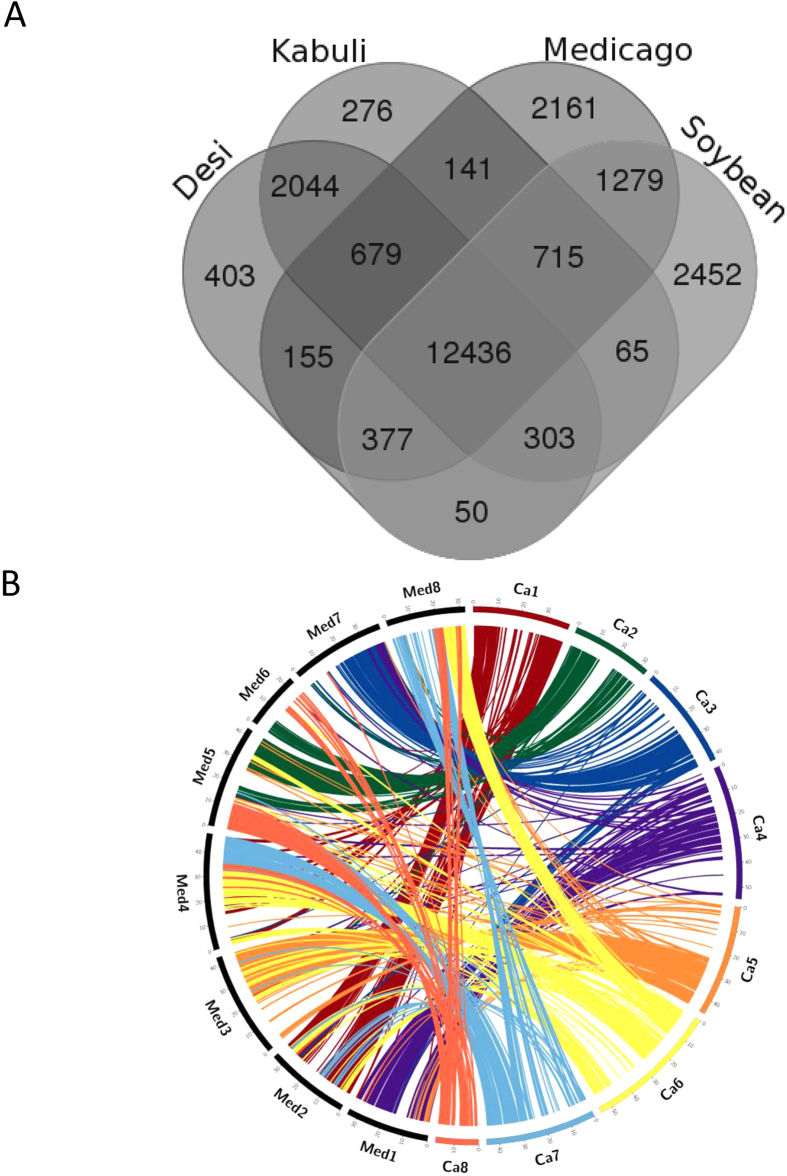
Figure 3. Comparative features of chickpea protein-coding genes.
(A). Venn diagram showing distribution of gene families among desi (ICC 4958) and kabuli (CDC Frontier) type chickpea, Medicago truncatula and soybean. (B). Circos diagram presenting syntenic relationship between chickpea (Ca) and Medicago truncatula (Mt) pseudomolecules. Mt pseudomolecules are shown in black and labeled as Med1–5. Chickpea pseudomolecules are labeled in different colours and labeled as Ca1-8. Colinear blocks are coloured according to the colour of the corresponding chickpea pseudomolecule.

