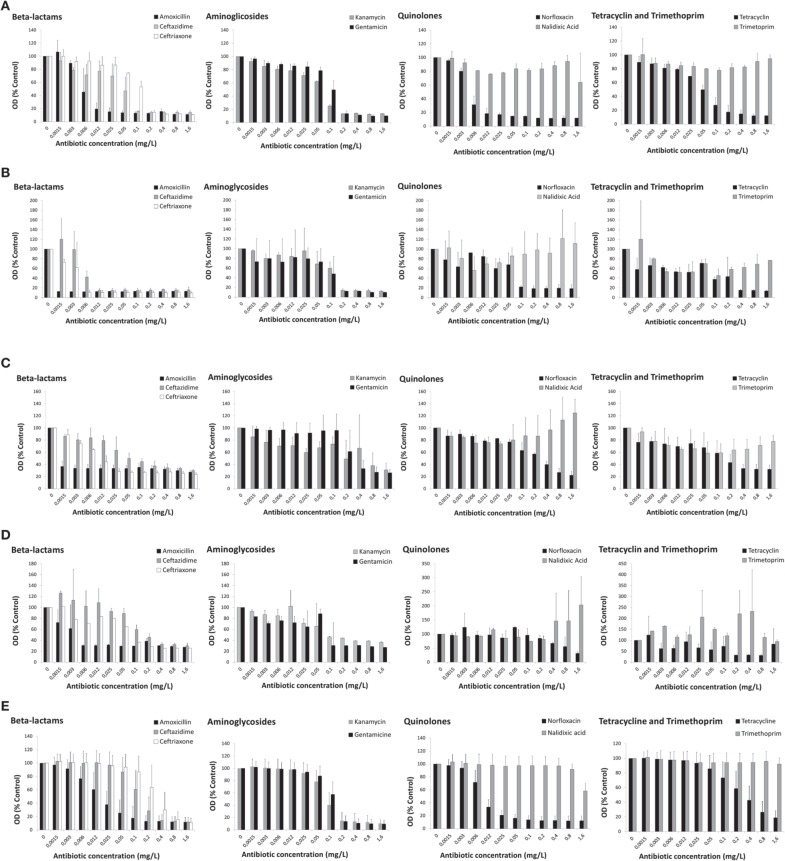
Figure 1.
Dose-response curves of cyanobacteria strains (5 × 10⁵cells/mL—inoculum 1) exposed to nine antibiotics from five distinct antibiotic classes for 13 days. (A) Microcystis aeruginosa LMECYA 7; (B) Aphanizomenon gracile LMECYA 40; (C) Chrisosporum berghii LMECYA 246; (D) Planktotjrix agardhii LMECYA 260; (E) Mean values of nine Microcystis aeruginosa strains (LMECYA 7, 50, 91B, 108, 113, 142, 151, 159, and 167). In (A–D), the data are expressed as values of optical density (450 nm) in relation to the control (non-treated cells) for each strain. Bars represent the mean plus standard deviation from two independent experiments, obtained for each antibiotic concentration (within the range of 0.0015–1.6 mg/L). In (E), the data are expressed as the mean values of optical density (450 nm) in relation to the control (non-treated cells) of the nine LMECYA strains (7, 50, 91B, 108, 113, 142, 151, 159, and 167). Bars represent the mean plus standard deviation from three independent experiments (two for strain LMECYA7), obtained for each antibiotic concentration (within the range of 0.0015–1.6 mg/L).

