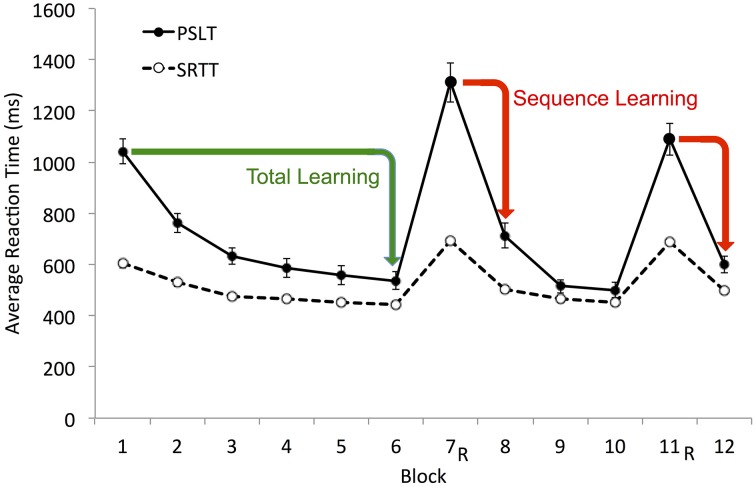
Figure 4.
Illustration of Total and Sequence Learning measures. Average group data is shown. Total Learning, difference between mean RT on Block 1 and Block 6 (Block 1–Block 6); Sequence Learning, the average drop in mean RT from the two random blocks (7 and 11) to the proceeding sequence blocks (8 and 12, respectively). These RT-difference scores for PSLT are illustrated by the green and red arrows. R, random block; PSLT, Predictive Sequence Learning Task; SRTT, Serial Reaction Time Task. Error bars represent the standard error of the mean. The SRTT data illustrated here includes the RT from all trials; see Supplementary Material Figure 1 for a different version of this figure showing the SRTT data excluding error trials.

