
FIGURE 3.
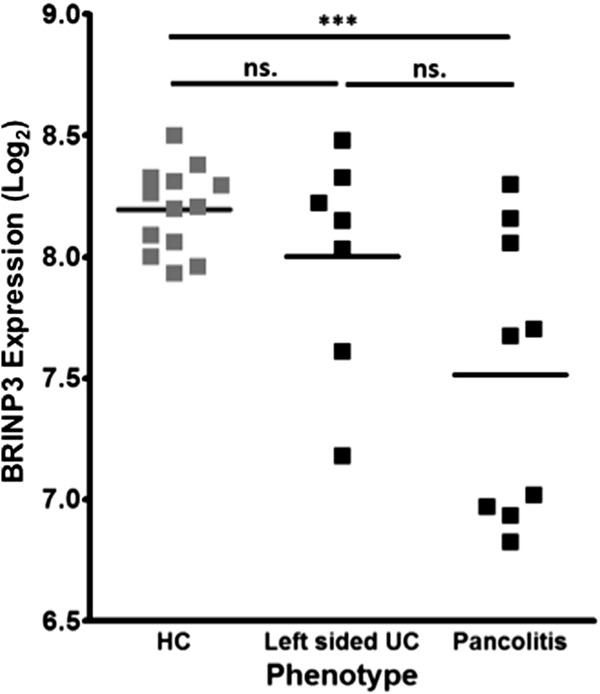
BRINP3 expression relationship to UC phenotype. Dot plot of BRINP3 Log2 expression in the ascending colon in HCs (n = 13) and in patients with UC (n = 16) divided according to phenotype using the Montreal classification (E3, pancolitis = 9; E2, left-sided colitis = 7).3 ***P < 0.001; ns, nonsignificant.