
Figure 6. Effects of TAC without and with TBHQ treatment on myocyte apoptosis.
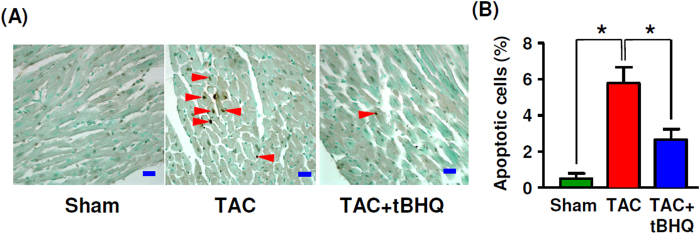
(A) Images of TUNEL staining showing apoptotic cells (arrowheads) in LV (bar = 20 μm). (B) Count of apoptotic cells (expressed as % of the total nuclei counted) in different groups. *P < 0.05, one-way ANOVA (n = 5 animals).