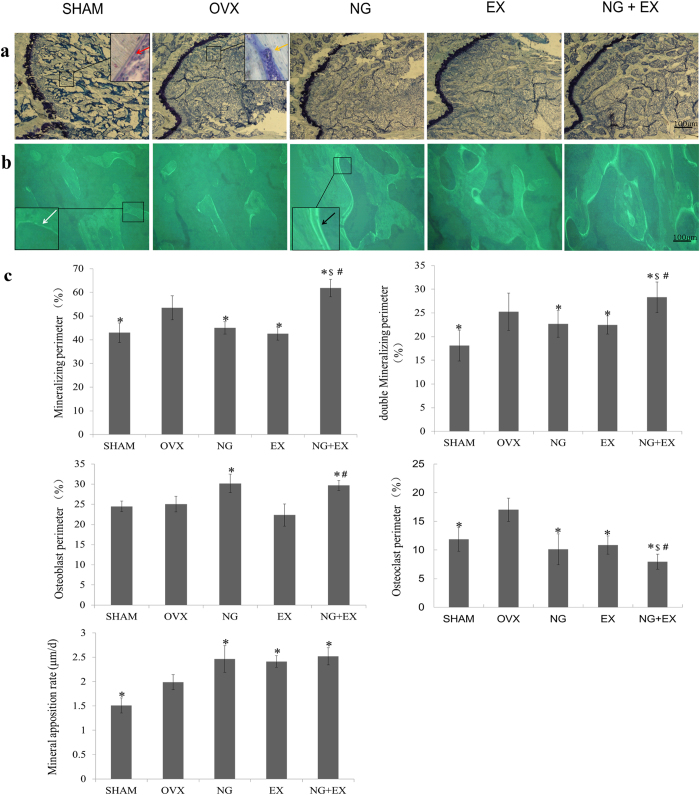
Figure 3.
(a) Undecalcified histological sections, stained with giemsa, of the sagittal plane through the distal of femur (magnification, ×100); the scale bar represents 100 μm. The red arrows show the osteoblast perimeters, visible aligned osteoblasts. The yellow arrows show the osteoclast perimeters, visible absorption of osteoclasts. (b) Undecalcified sections observed under a laser confocal scanning microscope showing the tetracycline fluorescence (magnification, ×100); the scale bar represents 100 μm. The white arrows show the single mineralizing (single labeled). The black arrows show the double mineralizing (double labeled). (c) Quantitative results of the mineralizing perimeter, double mineralizing perimeter, osteoblast perimeter, osteoclast perimeter and MAR, n = 5 specimens/group. Values are mean ± Standard deviation, n = 5. *p < 0.05, OVX group; #p < 0.01, vs EX group; $p < 0.05, NG group as evaluated by ANOVA.

