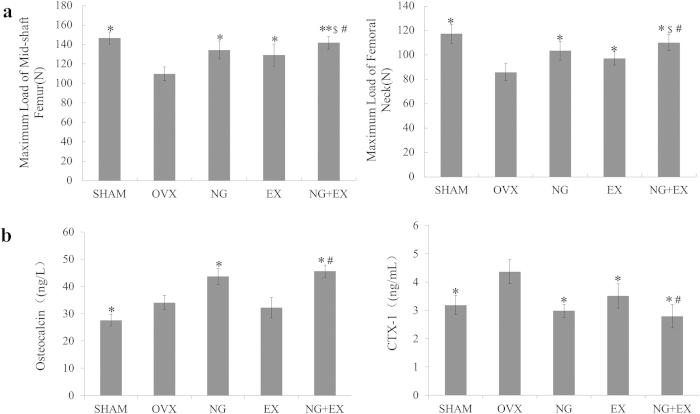
Figure 4.
(a) Biomechanical results expressed as maximum load of mid-shaft femur and femoral neck, n = 10 specimens/group. (b) Results of the serum analysis of OCN and CTX-1, n = 6 samples/group. Values are mean ± Standard deviation. *p < 0.05, **p < 0.05 vs. OVX group; #p < 0.05, vs. EX group; $p < 0.05, vs. NG group as evaluated by ANOVA.

