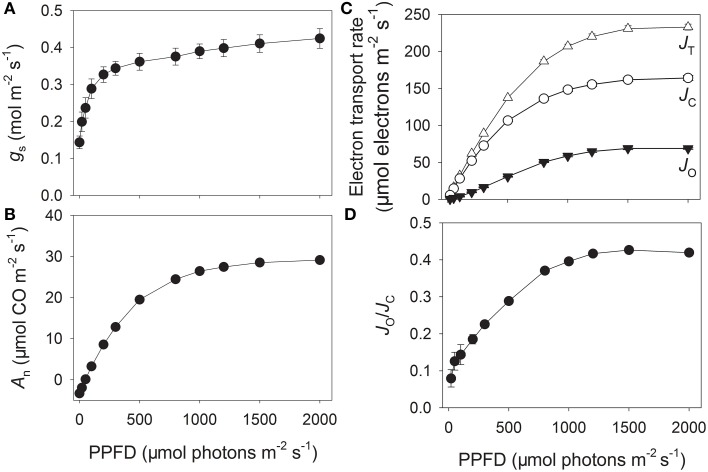
Figure 1.
Light response changes in stomatal conductance (gs) (A), CO2 assimilation (An) (B), total electron flow through PSII (JT) (C), electron flow devoted to RuBP carboxylation (JC) (C), electron flow devoted to RuBP oxygenation (JO) (C), and JO/JC ratio for leaves of tobacco (D). Measurements were conducted at 25°C and 400 μmol mol−1 CO2. Values are means ± SE (n = 4).

