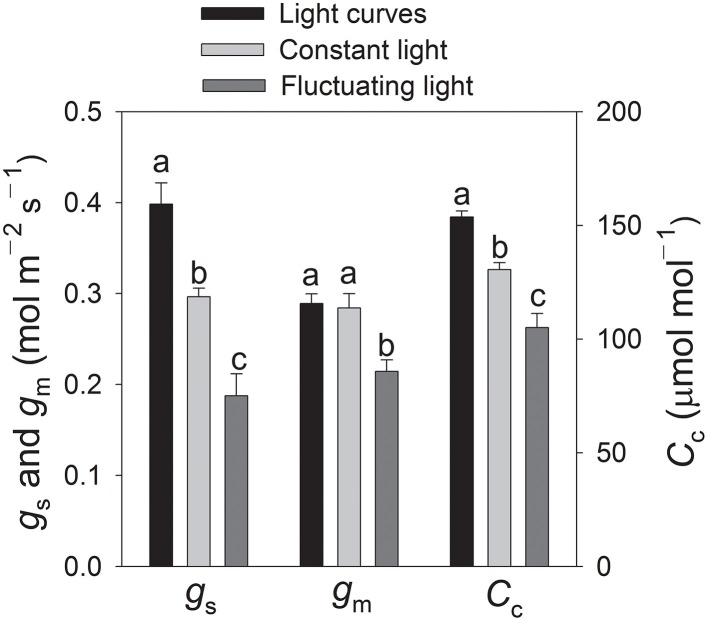
Figure 7.
Values for stomatal conductance (gs), mesophyll conductance (gm), and chloroplast CO2 concentration (Cc) at 1200 μmol photons m−2 s−1 analyzed in light response curves, constant vs. fluctuating light levels after 60 min of treatment. Measurements were conducted at 25°C and 400 μmol mol−1 CO2. Values are means ± SE (n = 4). For each treatment type, different letters indicate significant differences among light treatments (P < 0.05), based on Tukey's multiple comparison tests.

