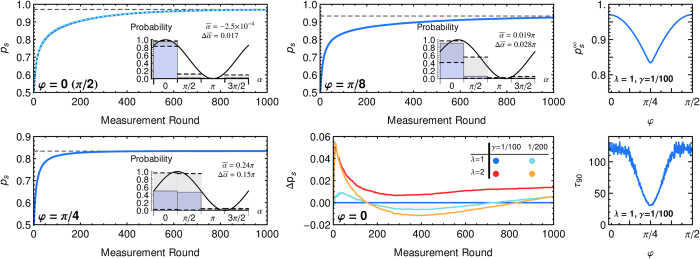
Figure 3. Learning curves.

Left: The success probability ps as a function of number of measurement rounds on the qubit in state |φ〉 is shown for four angles as averaged over an ensemble of N = 1000 agents running in parallel (λ = 1, γ = 1/100). The time scale of learning can be rescaled by increasing both λ and γ. Dashed lines give analytical approximations of the asymptotic values (see text). The insets show the transition probabilities of the average agent after 1000 learning steps,  , where
  is the ensemble average of the weight hα, together with the minimal and maximal probabilities obtained in the ensemble (as error bars), and the analytical curve of p(+1|φ, α). From the transition/measurement probabilities of a single agent j we infer30,31 its mean angle
  . The ‘‘vector sum’’ of the mean angles of the
  individual agents is the complex number
  , which determines the ensemble average of the mean angle
  and its circular standard deviation
  . Bottom middle: A higher reward scaling λ and lower damping rate γ give a faster initial learning and a higher asymptote, with a slower final convergence for the latter. Curves show the differences of all ps with the reference case λ = 1, γ = 1/100. Top right: Asymptotic success probability
  (analytical approximation) as a function of φ for 4 projectors. The curve is π/2-periodic. Bottom right: Learning time τ90 for the ensemble of agents to reach 90% of
  . Data is the average of the learning times of 1000 agents.
