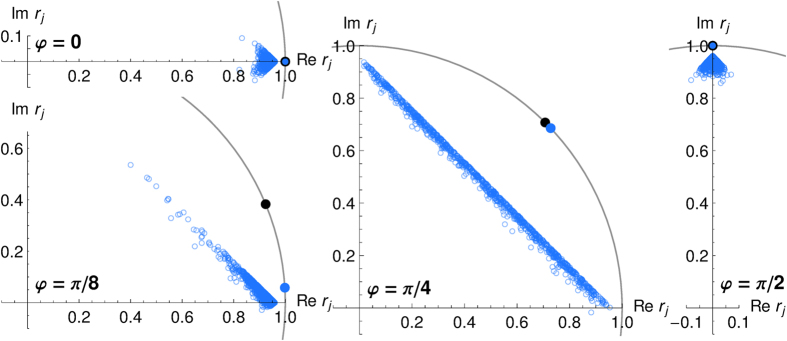
Figure 4. States of each agent in an ensemble of 1000 agents with four available measurement directions after 1000 measurements for φ = 0, π/8, π/4, π/2: States are summarized as the position of the resulting vectors  for each agent j in the complex plane (equatorial plane).

The degeneracy with respect to the expected reward for φ = π/4 provides a manifold of equally successful states, which is populated by the ensemble. Blue dot on the unit circle gives the angle of the ensemble average, the black dot is the angle φ.
