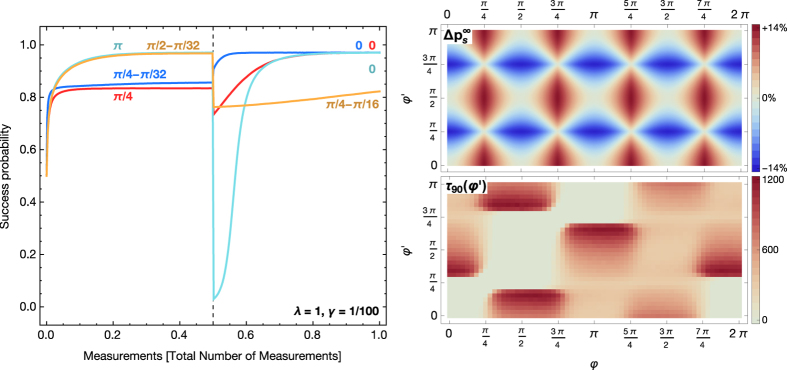
Figure 7. Relearning after a sudden change of B leading to a shift from φ to φ′.

An ensemble of 1000 agents first learns with φ for M/2 measurements, after which the angle changes to φ′ for another M/2 measurements, λ = 1, γ = 1/100. Left: Examples of learning curves for 4 different switches. φ and φ′ are given in the same color as the corresponding learning curve (M = 10000 for blue and M = 3000 for the other examples). Right top: The asymptotic success probability (analytically obtained) shifts due to the change in angles. Right bottom: The relearning time τ90 to reach 90% of the asymptotic success probability after the field has changed also gives rise to a periodically repeating pattern and shows a structure commensurate with the choice of projectors in intervals of π/2.
