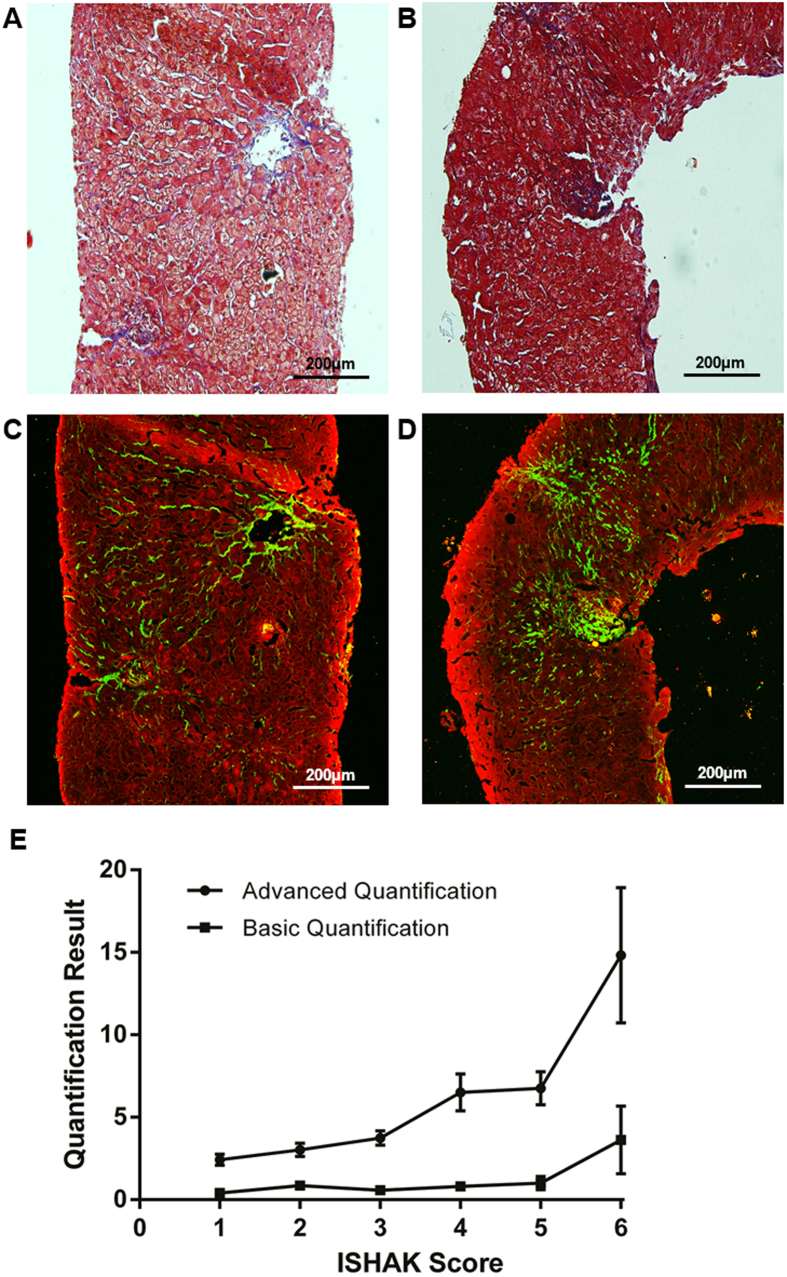
Figure 1. Comparison between SHG/TPEF imaging and linear microscopy after Masson’s trichrome staining.
(A) and (B) represent fibrotic liver sections stained with Masson’s trichrome. Collagen fibers are stained in blue, and hepatocytes are stained in red. (C) and (D) are SHG/TPEF microscopy images. Fibrillar collagen (green) was detected by an SHG signal, and hepatocyte morphology (red) was observed with TPEF. (E) Correlations between the ISHAK scores and SHG/TPEF microscopy quantification results of samples from the training cohort. The total collagen levels are represented by solid squares, and the advanced collagen readings are represented by solid circles.

