Figure 5.
Validation of Candidate Genes TDC1 and TDC2 within QTL Interval Using Association Analysis.
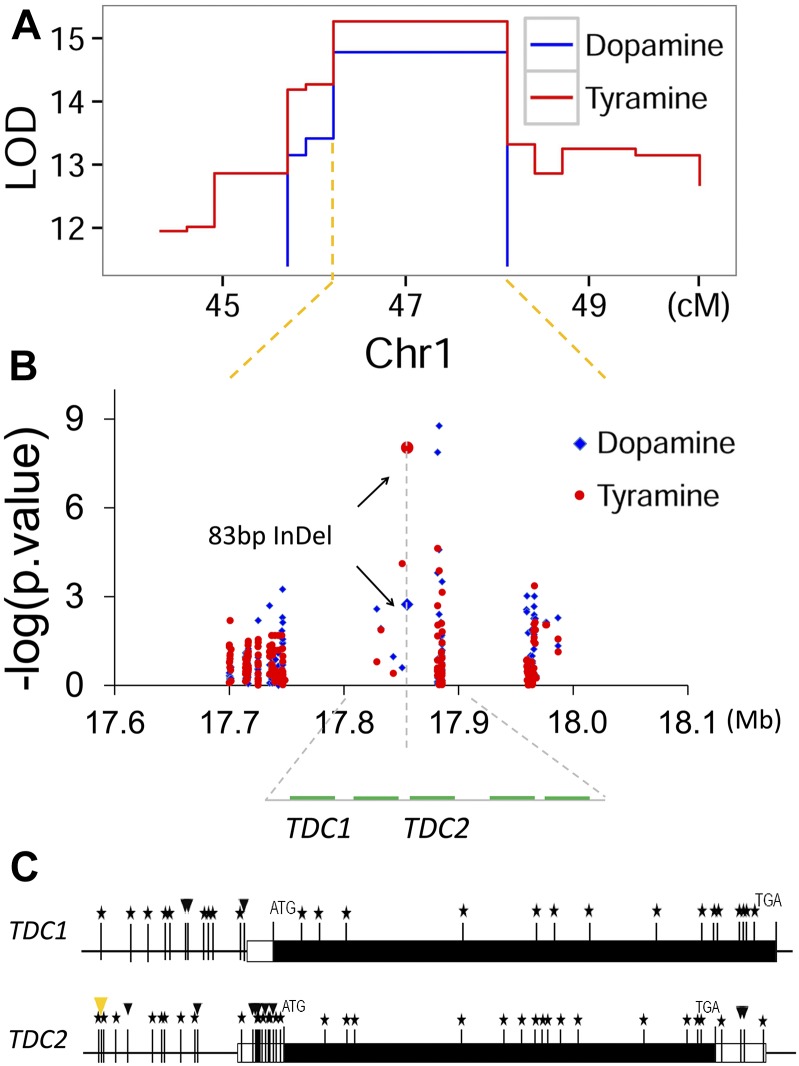
(A) Diagram of linkage mapping result for the level of tyramine and dopamine in maize leaves at reproductive stage. LOD values of the bins at the peak of QTL interval are shown as a function of their genetic positions.
(B) Scatterplot of association results between polymorphic markers (i.e., SNPs and InDels) in the peak bin and the level of metabolites tyramine and dopamine in maize leaves at reproductive stage. The −log10-transformed P values from the association analysis are plotted against the genomic physical position. Genes located within the 17.8- to ∼17.9-Mb region on chromosome 1 are indicated as green bars. Association analysis was performed using the mixed linear model controlling for the population structure (Q) and kinship (K).
(C) Gene structure of TDC1 and TDC2 and sequence variation between alleles from By804 and B73. Stars mark SNPs, while arrowheads mark insertion-deletion polymorphisms (InDels) between the allelic sequence of By804 and B73. The bigger orange arrowhead in the promoter region of TDC2 represents the 83-bp InDel.

