Figure 7.
Dissection of Metabolite and Candidate Genes Associated with Length of Ear Leaf.
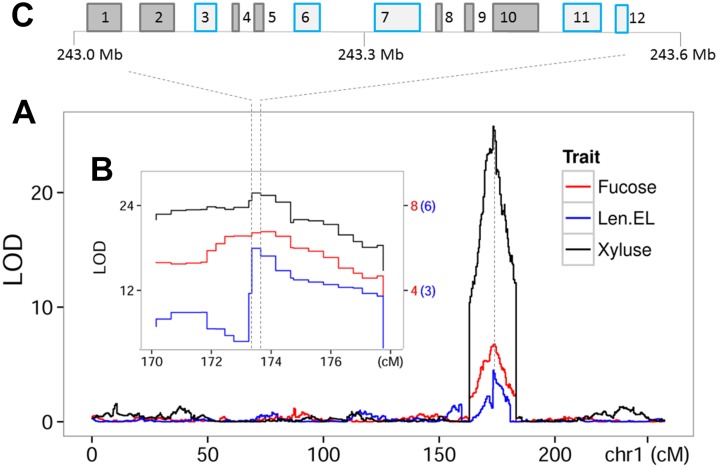
(A) LOD curves of QTL mapping for length of ear leaf (Len.EL) and level of fucose and xylulose in maize leaves on chromosome 1. QTLs for these three traits overlap at ∼174 cM on chromosome 1.
(B) LOD values of the bins at the peak of QTL interval identified in (A) are shown as a function of their genetic positions.
(C) Graphical representation of genes within the genomic region spanning the single bin at the peak. Twelve genes represented by boxes were found within the ∼600-kb region. Five genes that have putative function are marked in light blue.

