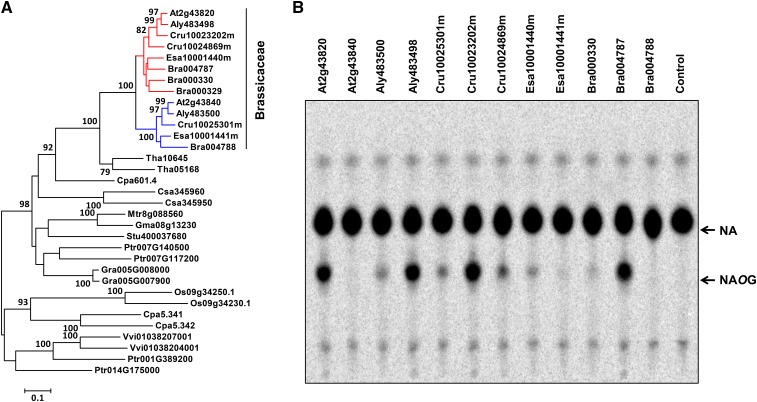
Figure 12.
Phylogenetic Analysis and Biochemical Assays of UGT74 Proteins.
(A) Maximum likelihood tree of UGT74F2 and homolog proteins from other plant species (>40% identity). Bootstrap values (based on 1000 replications) >75% are shown for corresponding nodes. The clade of UGT74F1-like proteins and that of UGT74F2-like proteins are highlighted in blue and red, respectively. The scale measures evolutionary distance in substitutions per site. Aly, Arabidopsis lyrata; Bra, Brassica rapa; Cpa, Carica papaya; Cru, Capsella rubella; Csa, Cucumis sativus; Esa, Eutrema salsugineum; Gma, Glycine max; Gra, Gossypium raimondii; Mtr, Medicago truncatula; Os, Oryza sativa; Ptr, Populus trichocarpa; Stu, Solanum tuberosum; Tha, Tarenaya hassleriana; Vvi, Vitis vinifera.
(B) In vitro biochemical assays of proteins belonging to the UGT74F subfamily.

