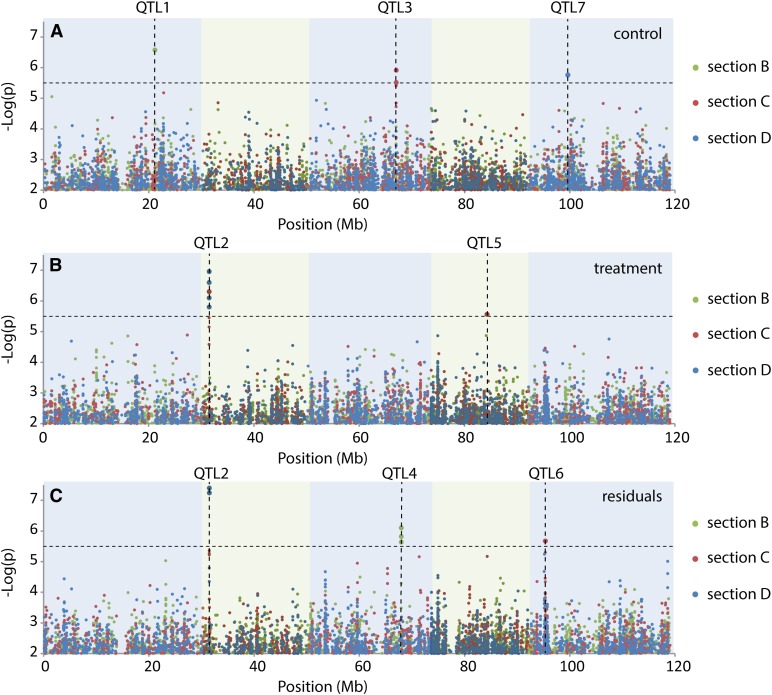
Figure 5.
Manhattan Plots Representing the Associations between SNP Markers and Silique Length in the Regions B, C, and D.
(A) GWA mapping of silique length in control plants.
(B) GWA mapping of silique length in heat-treated plants.
(C) GWA mapping of residuals, representing heat response independent of silique length in control conditions.
Dotted line represents the significance threshold of –log(P value) = 5.5.

