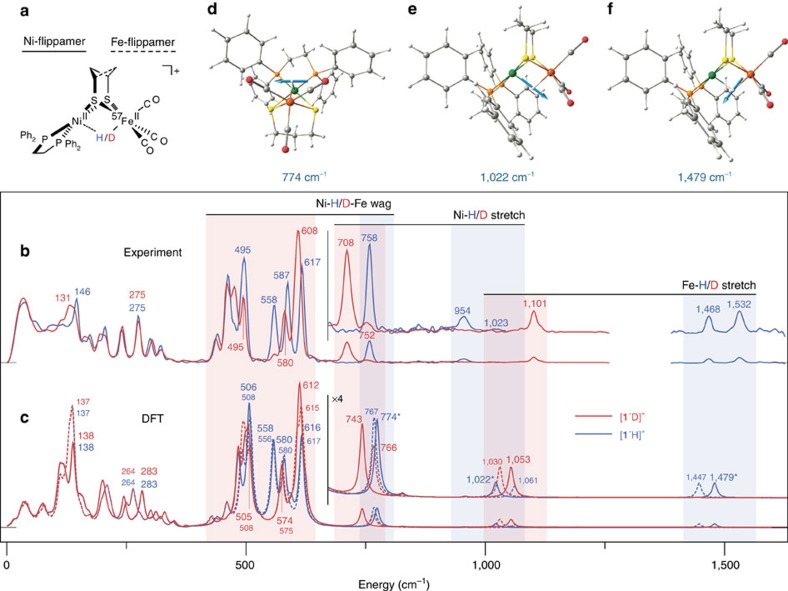
Figure 2. Metal-hydride bands for complexes [1′H/D]+.
(a) Structure of [1′H]+ showing ‘flippamer' conformations of the pdt2− ligand. (b,c) Full-range 57Fe PVDOS for [1′H]+ (blue trace) and [1′D]+ (red trace) from NRVS experiments (b) and DFT calculations (c). In c, the plain/broken traces are spectra calculated for the dominant/alternative Ni-/Fe-flippamer, respectively. Spectra are repeated in the region >700 cm−1 with their intensities × 4 amplified. The colour bars highlight specific M–H/D bands, as well as their shifts on isotopic substitution. (d–f) Scaled-arrow representations of the M–H normal modes calculated for the Ni-flippamer of [1′H]+ are shown, with the corresponding bands indicated (*) in c. Unscaled-arrow and animated representations of these M–H modes can be found in Supplementary Fig. 22 and Supplementary Movies 1,2,3, respectively.

