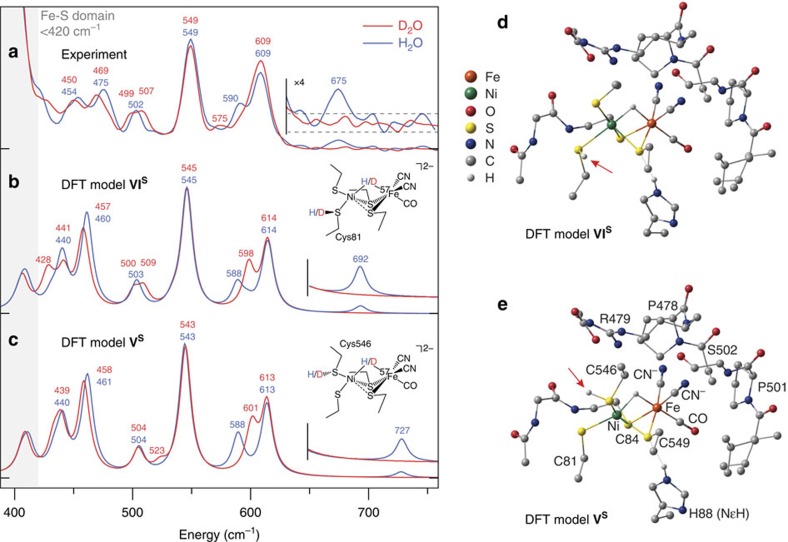
Figure 3. Ni–H–Fe-hydride wag exposed in the reduced state Ni-R of [NiFe]-hydrogenase.
(a–c) High-frequency NRVS for [NiFe]-hydrogenase reduced in H2O (blue trace) and D2O (red trace; a) and the corresponding 57Fe PVDOS simulations given for the representative DFT models VIS (b) and VS (c). The higher regions of spectra containing the Ni–H–Fe wag band (in H2O samples) are repeated with their intensities × 4 amplified. The low-energy region of the Ni-R spectrum in H2O reveals a triplet of bands (454, 475 and 502 cm−1) that correspond to those located at 440, 461 and 504 cm−1 in the calculated spectrum of the model VS. Further, two intense bands seen at 549 and 609 cm−1 in Ni-R map on calculated bands at 543 and 613 cm−1, with an additional weak band observed at 590 cm−1 that can be correlated with the calculated band appearing at 588 cm−1. (d,e) Representative DFT-optimized models VIS (d) and VS (e) for the Ni-R active site. Arrows indicate the position of CysSH. Non-substrate H atoms have been omitted for clarity (excluding HNɛ of His88).

