
Figure 1.
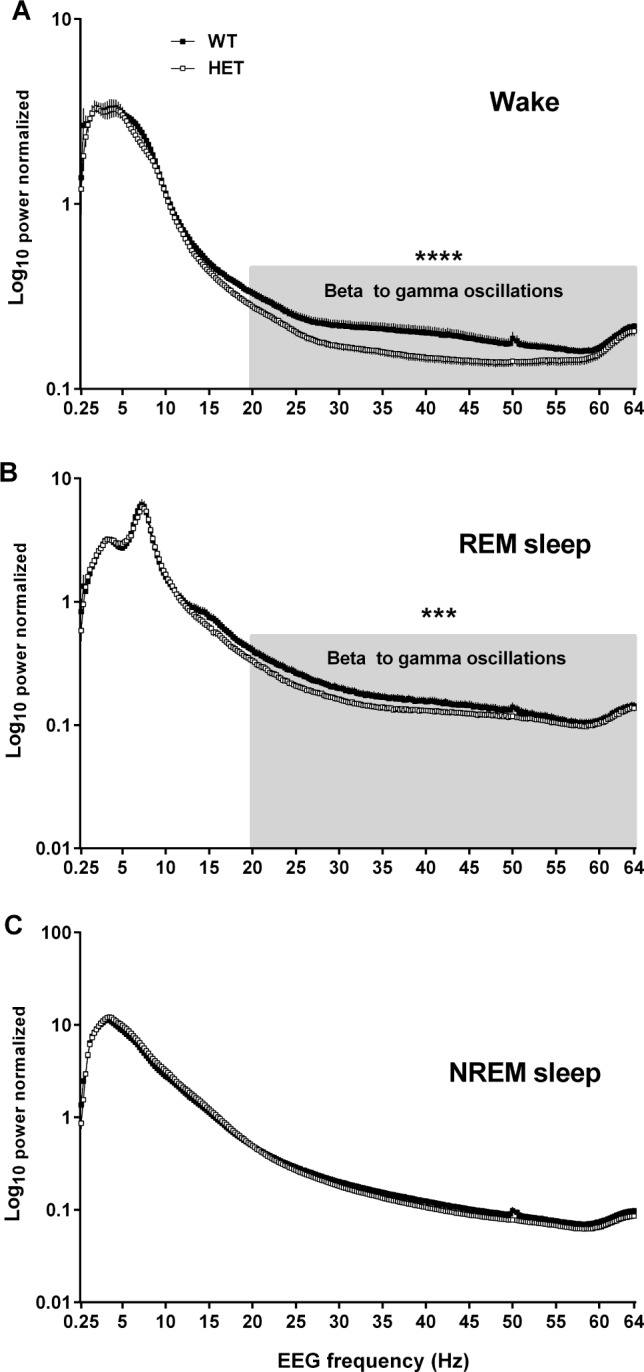
Changes in electroencephalogram (EEG) spectral power in different EEG frequencies (delta, 0.5–5 Hz; theta, 6–9 Hz; sigma, 10–15 Hz; beta-1, 16–23 Hz; beta-2, 23–32 Hz; gamma, 32–64 Hz) across all three vigilance states in heterozygous Cacna1c knockout (HET; n = 11) mice and wild-type littermates (WT; n = 12). (A) Wakefulness (Wake), (B) rapid eye movement (REM) sleep, and (C) nonrapid eye movement (NREM) sleep. All values are mean ± standard error of the mean. Horizontal gray areas indicate frequency ranges that show statistical differences between WT and HET: ***P < 0.001, ****P < 0.0001 (oneway analysis of variance with Bonferroni post hoc test).