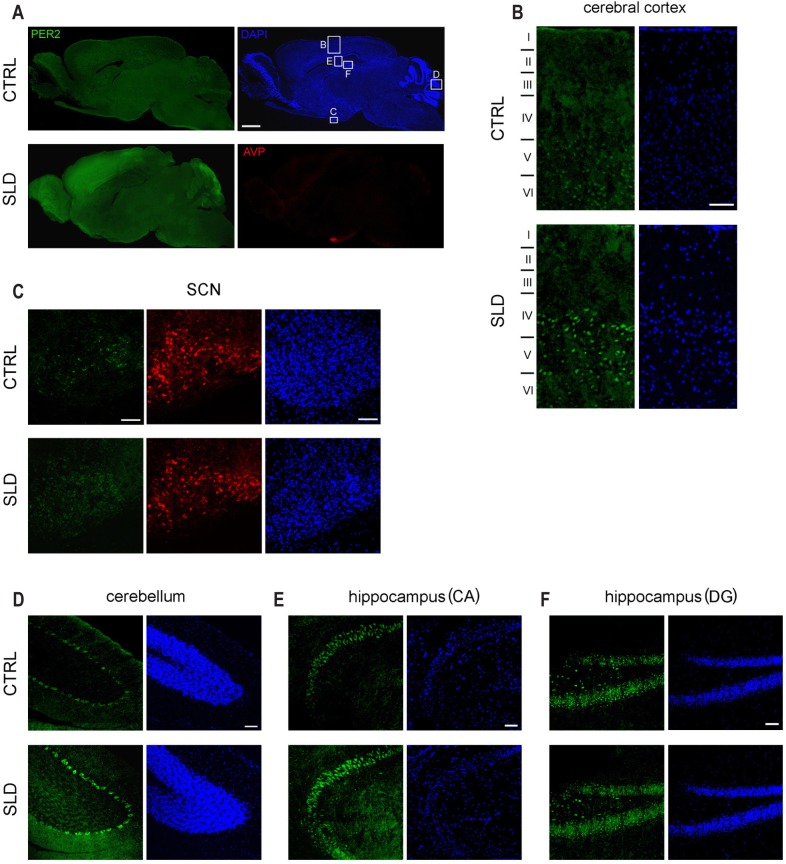
Figure 2.
Brain immunohistofluorescence of PER2 after a 6-h sleep deprivation. (A) Representative examples of sagittal brain sections of Per2Luc mice showing PER2 expression (green pseudocolor) at ZT6 under baseline conditions (CTRL) and after a 6-h sleep deprivation (SLD; ZT0–6). In addition, sections were stained for AVP (red), to mark the suprachiasmatic nuclei (SCN), and DAPI (blue), to visualize cell nuclei. White boxed areas mark the five brain regions detailed in Panels B-E; i.e., cerebral cortex (B), SCN (C), cerebellum (D), and the hippocampal areas cornu ammonis (CA) (E) and dendate gyrus (DG) (F). Roman numerals in panel B indicate cortical layers I-VI with tick marks estimating layer boundaries based on visual inspection of cytoarchitectural variation in each section. Scale bar in panel A is 1,250 μm and in panels B–F 50 μm.

