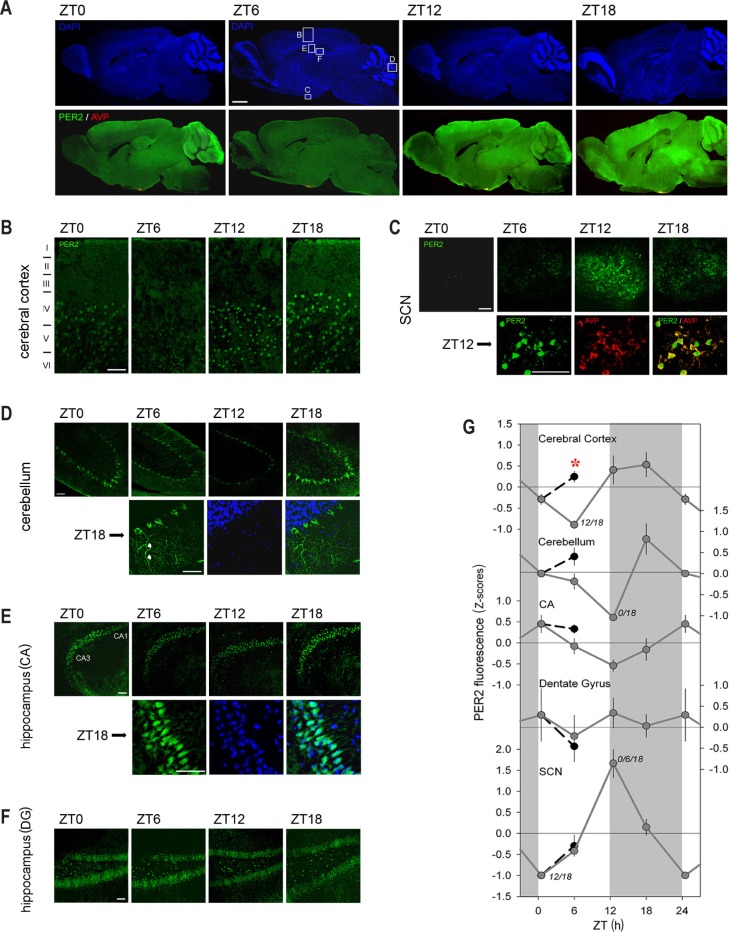
Figure 3.
Brain immunohistofluorescence of PER2 as a function of time of day. (A) Sagittal brain sections of Per2Luc mice showing PER2 levels (green) costained with an AVP antibody (red; lower 4 panels) at ZT0, ZT6, ZT12, and ZT 18. Note the red AVP staining in the suprachiasmatic nuclei (SCN) (C) turning yellow when PER2 is high (ZT12 and ZT18). The same sections were counterstained for DAPI (blue; upper four panels). Detailed PER2 staining is shown for cerebral cortex (B), SCN (C), cerebellum (D), and the cornu ammonis (CA) (E) and dendate gyrus (DG) (F). Details for SCN (C), cerebellum (D), and CA (E) shown at higher magnification at times of high PER2 expression (i.e., ZT12, ZT18, and ZT18, respectively). Note that (1) many PER2 positive cells can be seen in cortical layers IV and V, (2) most PER2 positive cells (green) in the SCN also express AVP (red; yellow when overlain), (3) the cytoplasm and axons but not the nuclei of Purkinje neurons in the cerebellum express PER2 (see white arrows), and (4) many cells in the hippocampus, specifically in the granule cell layer and subgranular zone, are PER2 positive. (G) Quantification of PER2 fluorescence for the five brain regions at ZT0 (double plotted at ZT24), ZT6, ZT12, and ZT18 (gray line) and at ZT6 after a 6-h sleep deprivation (SLD; ZT0–6; black line; see data in Figure 2). Numbers beside data points indicate other ZT times from which the data point significantly differed (post hoc Tukey; P < 0.05). Note that SLD significantly changed PER2 levels only in the cerebral cortex (red asterisk; post hoc t test; P < 0.05). Gray areas mark the 12-h dark periods. Scale bar in panel A is 1,250 μm, in panels B–E and in details 50 μm. See Figure 2 for details.

