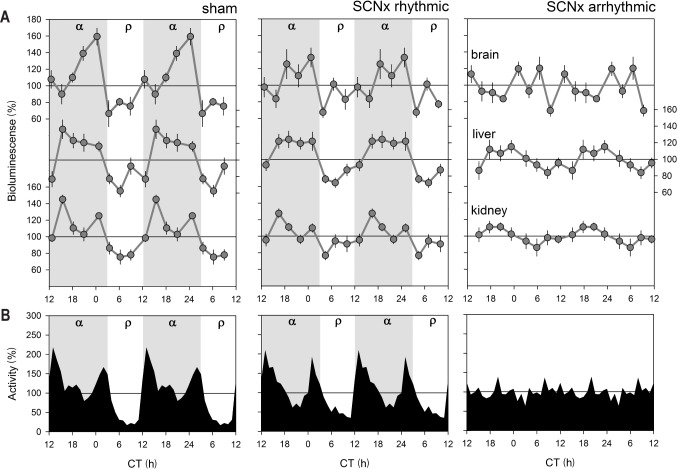
Figure 4.
PER2 bioluminescence levels as a function of circadian time (CT) in sham operated mice and in rhythmic and arrhythmic suprachiasmatic nuclei (SCN)-lesioned mice under constant dark conditions. (A) Mean (± 1 standard error of the mean) bioluminescence levels in brain, liver, and kidney under baseline conditions (CT0–24; 3-h intervals; gray line; for n/group/tissue see Table 1). Values were expressed as percentage of individual mean bioluminescence in baseline before averaging. CT within individuals was calculated according the individual's free-running period using activity onset as CT12 for the sham and SCNx/rhythmic Per2Luc mice (see panel B). For SCNx/arrhythmic mice mean period and activity onset of the sham group were used to construct an average time course. (B) Mean circadian locomotor activity waveforms for sham lesioned and SCNx-rhythmic and -arrhythmic mice. Activity values were expressed as a percentage of each individual's mean activity. Note the two peaks in the activity for Sham and SCNx/rhythmic mice. Gray and white areas delineate the subjective dark or active (α) and light or rest (ρ) periods, respectively.

