
. 2015 Jul 2;114(3):406–417. doi: 10.1017/S0007114515001786
© The Authors 2015
This is an Open Access article, distributed under the terms of the Creative Commons Attribution licence (http://creativecommons.org/licenses/by/3.0/), which permits unrestricted re-use, distribution, and reproduction in any medium, provided the original work is properly cited.
Fig. 2.
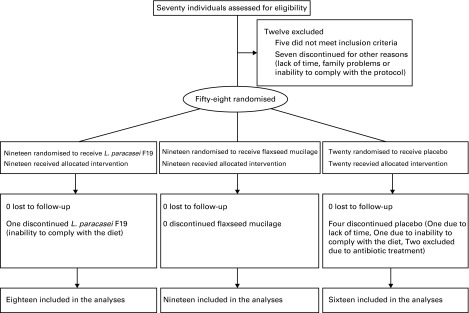
Flow chart of the study.