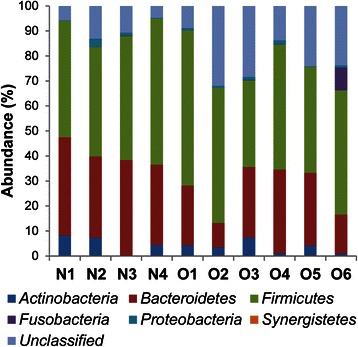
Fig. 2.

Phylum-level classification of bacteria identified in individual stool samples. N-numbered samples were obtained from non-obese subjects, whereas O-numbered samples were obtained from obese subjects. Each bar represents the percent contribution of phylum-level profiles grouped by non-obese-obese status or for each individual. The phyla represented by the different colors are shown below the figure
