
Figure 1.
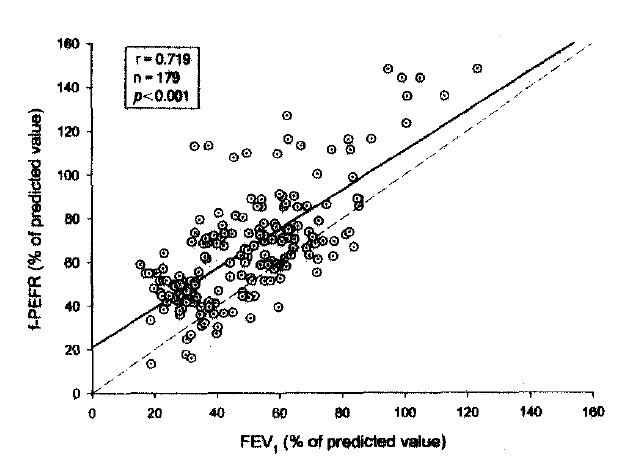
The relationship between FEV1 and f-PEFR measurements (% predicted values). The applied predicted values were by Crapo et al.12) for FEV1 and by Leiner et al.14) for PEFR. Line of identity is shown (dashed). Regression equation: y = 0.90x + 21.0. There was a considerable skew in distribution of measurements toward the PEFR axis.