
Figure 2.
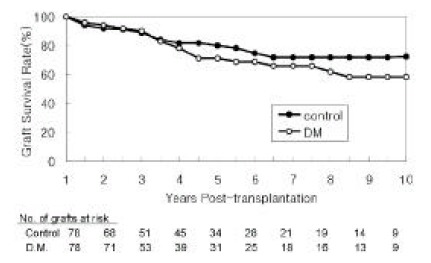
Graft Survival Rates
Survival rates were calculated over the ensuing 9 years assuming the first year post-transplant as the starting point.
Official websites use .gov
A
.gov website belongs to an official
government organization in the United States.
Secure .gov websites use HTTPS
A lock (
) or https:// means you've safely
connected to the .gov website. Share sensitive
information only on official, secure websites.
Graft Survival Rates
Survival rates were calculated over the ensuing 9 years assuming the first year post-transplant as the starting point.