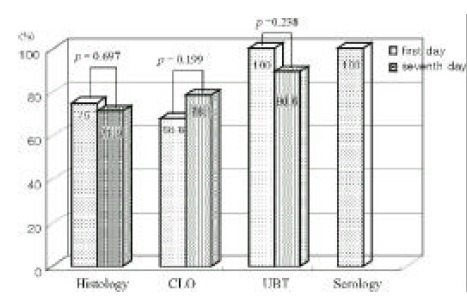
Figure 3.

This figure shows the comparison of diagnostic sensitivities between 2-times study. The sensitivity of the UBT has a tendency of decrease at examination of 7th day, and sensitivity of the CLO has a tendency of increment at examination of 7th day.
