Figure 5.

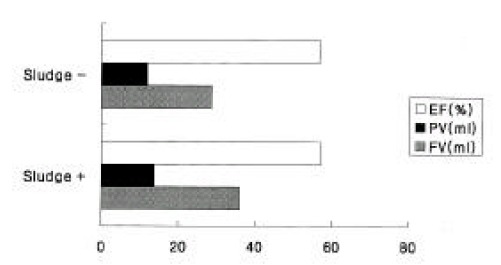
Changes in fasting (FV) and postprandial (PV) GB volumes and ejection fractions (EF) according to sludge formation. The GB volumes and ejection fractions were not statistically different between the two groups.

Changes in fasting (FV) and postprandial (PV) GB volumes and ejection fractions (EF) according to sludge formation. The GB volumes and ejection fractions were not statistically different between the two groups.