Figure 1.

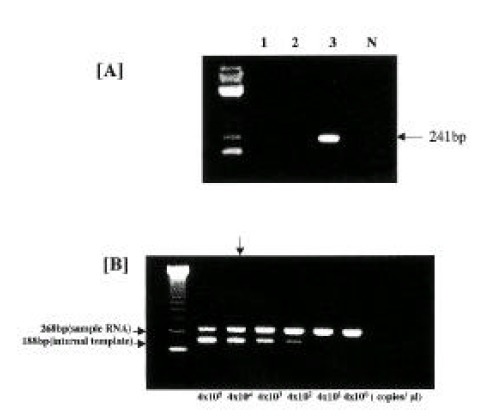
Determination of HCV genotype and HCV RNA quantitation by RT-PCR.
The lane 1, 2, 3 and N in the panel A shows genotype 1a, -1b, -2a and negative control, respectively. The band on the lane 3 shows 241 bp in fragment size corresponding genotype 2a. In the panel B, the upper bands depicting 268 bp in fragment size indicate amplified DNA fragments derived from serially diluted target HCV RNA, and the lower bands showing 188 bp indicate those from the internal template as competitor. At the equivalent point of signal intensities between the two bands, the amounts of target HCV RNA are the same as the copy numbers of the internal templates which are serially diluted. The arrows indicate the point of HCV RNA titer, 4 × 10⁴ copies/μL serum.
